Suite options apply across all Extreme Management Center applications. In the Options window (Tools > Options), the right-panel view changes depending on what you have selected in the left-panel tree. Expand the Suite folder to view the suite-wide options you can set.
Information on the following Suite options:
- Advanced SNMP Settings
- Advanced Suite Settings
- Alarm Configuration
- Alarm/Event Logs and Tables
- Client Connections
- Database Backup
- Data Display Format
- Date/Time Format
- Diagnostic Configuration
- ExtremeNetworks.com Update
- MAC OUI Vendor List
- Name Resolution
- Extreme Management Center Feedback Program
- Extreme Management Center Server Health
- Network Monitor Cache
- Port Monitor
- Services for Extreme Management Center Server
- SMTP E-Mail Server
- Status Polling
- System Browser
- Trap Configuration
- Tree
- Web Server
Advanced SNMP Settings
Selecting Advanced SNMP Settings in the left panel of the Options window provides the following view where you can elect to have the Extreme Management Center Server use the MyMibs directory or thirdparty directory.
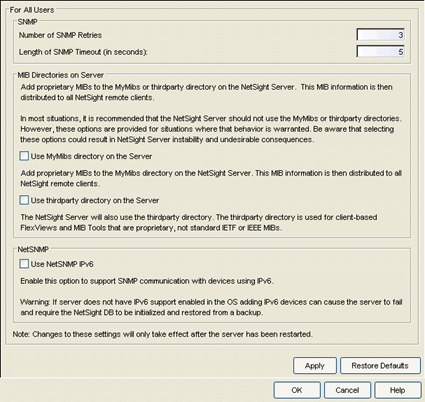
- Number of SNMP Retries
- The number of attempts made to contact a device after an attempt at contact fails. The default setting is 3 retries, which means that Console retries a timed-out request three time after the initial attempt at contact is made, making a
total of four attempts to contact a device. The value for this setting must be between 1 and 60 tries.
You can override this value on a per-device basis by highlighting a device in the Console device tree, accessing the Properties tab, and selecting the Access radio button. Enter the override value for the selected device in the Retries column.
- Length of SNMP Timeout (in seconds)
- The amount of time (in seconds) that Console waits before re-trying to
contact a device. The default setting is 5 seconds. The value for this setting must be between 3 and 60 seconds.
You can override this value on a per-device basis by highlighting a device in the Console device tree, accessing the Properties tab, and selecting the Access radio button. Enter the override value for the selected device in the Timeout column.NOTE: When SNMP requests are redirected through the server, all SNMP timeouts are extended by a factor of four (timeout X 4) to allow for the delays incurred by redirecting requests through the server.
The MyMibs directory is where you add proprietary MIBs to the MIB database on the Extreme Management Center Server. This MIB information is then distributed to the Extreme Management Center remote clients. If you select this option, the Extreme Management Center Server also uses the MyMibs directory (e.g. the MIBs will be included in the SNMP Server Stack).
The thirdparty directory is used for client-based FlexViews and MIB Tools that are proprietary (Enterprise MIBs owned by other companies), not standard IETF or IEEE MIBs. If you select this option, the Extreme Management Center Server will also use the thirdparty directory.
| CAUTION: | In
most situations, it is recommended that the Extreme Management Center Server should not
use the MyMibs or thirdparty directories. However, the option is
provided for situations where that behavior is warranted. Be aware that selecting this option could result in Extreme Management Center Server instability and undesirable consequences. |
|---|
The Use NetSNMP IPv6 option allows you to SNMP-manage network devices that have IPv6 addresses assigned to them. You must have this option selected in order to be able to add a device with an IPv6 address.
These options apply to all users. For these setting to take effect, the Extreme Management Center Server must be restarted.
Advanced Suite Settings
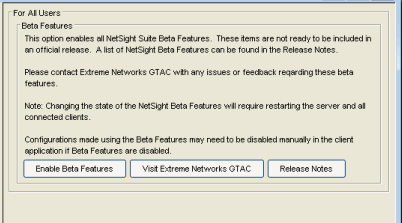
Selecting Advanced Suite Settings in the left panel of the Options window provides the following view where you can enable or disable Extreme Management Center Suite Beta features. A list of the beta features can be found in the Extreme Management Center Suite Release Notes. When you enable the Beta features, you will be asked for a Beta Activation Key. Contact Extreme Networks Support to obtain a Beta Key. Once you enable the beta features, the button will change to "Disable Beta Features."
This option applies to all users. For this setting to take effect, the Extreme Management Center Server must be restarted.
Alarm Configuration
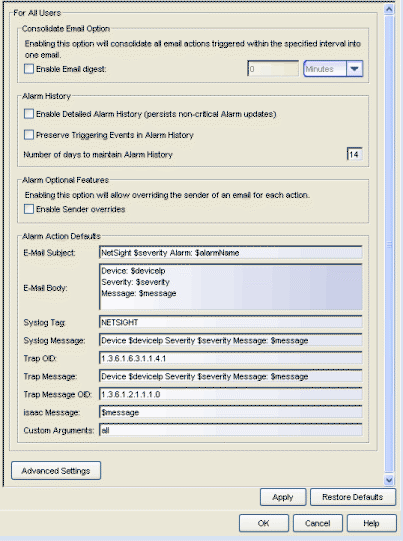
Selecting Alarm Configuration in the left panel of the Options window provides the following view where you can configure options for how alarms are handled on your network. These settings apply to all users.
Click areas in the window for more information.
Consolidate Email Option
This option allows you to combine alarm action emails into a single email. Select the option and specify an interval. Email notifications will be collected over the specified interval and then delivered as a single consolidated email.
Alarm Optional Features
The Enable Sender Overrides option adds an E-Mail Sender and E-Mail Sender Password field to the Console Alarms Manager Edit Action Overrides window. This allow you to override the sender of an email for an alarm email action, including the ability to set the sender's password, if needed. Since alarms are typically sent out as email/text messages, this option allows IT staff to set different ring-tones based on the alarm definition. Doing this on a smartphone typically involves changing the ring-tone for calls from a specific person.
Alarm History
Enable Detailed Alarm History
By default, a history record is created the first time an alarm is raised on a device or interface, and also when it is cleared. If you enable Detailed Alarm History, repeat occurrences of an alarm being raised will also be recorded.
Preserve Triggering Events in Alarm History
This option preserves alarm triggering events, so that any triggering events are stored with the alarm history record. This allows you to view the triggering event by clicking the View Trigger button in the Alarm History window.
Number of Days to Maintain Alarm History
Specify (in days) how long the Alarm History will be retained.
Alarm Action Defaults
Use this section to define the default content for alarm action messages. For example, with an email action, you can define the information contained in the email subject line and body. With a syslog or trap action, you can specify certain information that you want contained in the syslog or trap message. These values will be used unless they are overridden in an individual alarm.
The message content is configured as a template, with the content passed directly as typed, except for the variable information which is specified by $keyword. The variable information ($keyword) is replaced with information from the alarm when the alarm action is executed.
Following is a list of the most common keywords used. For a complete list of available Alarms Manager keywords, see the Edit Action Overrides window in the Console online Help.
- $alarmName – the name of the alarm.
- $severity – the alarm severity.
- $deviceIP – the IP address of the device that is the source of the alarm.
- $message – the event message.
- $time – the date and time when the event or trap occurred.
- Custom Arguments
- Specifies the arguments passed to a program. Each argument is delimited by spaces. An argument can be a literal, passed to the program exactly as typed, or a variable, specified as $keyword. A group of literals and variables can be combined into a single argument by using double quotes. "All" is a special value that tells Extreme Management Center to pass all variable values to the program as individual arguments.
- Advanced Settings
- Click the Advanced Settings button to open the Alarm Advanced Settings window where you can set advanced alarm options.
Alarm/Event Logs and Tables
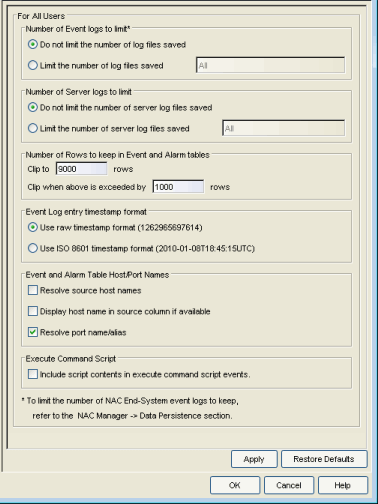
Selecting Alarm/Event Logs and Tables in the left panel of the Options window provides the following view where you can specify options for limiting disk usage by alarm and event logs, and Extreme Management Center server logs. These settings apply to all users. You must be assigned the appropriate user capability to configure these options. For more information on configuring log files, see the Extreme Management Center Log Files Help topic in the Console online Help.
Click areas in the window for more information.
- Number of Event logs to limit
- This option lets you limit the number of application log files that are
saved to the
<install directory>\appdata\logs directory. It does not limit the number of Traps or Syslog logs that are saved. Specify one of the following options:- Do not limit the number of log files saved – Allows you to keep any number of application log files.
- Limit the number of log files saved – Sets a limit to the number of application log files saved. Older files are deleted when the maximum number is reached. Enter the desired number.
- Number of Server logs to limit
- A new server log is created every day. This option lets you limit the number of
server log files that are
saved to the
<install directory>\appdata\logs directory. Specify one of the following options:- Do not limit the number of server log files saved -- Allows you to keep all server log files.
- Limit the number of server log files saved -- Sets a limit to the number of server log files saved. Older files (determined by the date of the file in the filename) are deleted when the maximum number is reached. Enter the desired number.
- Number of Rows to keep in Event and Alarm table
- These settings determine the number of table rows that will be displayed in all of the logs in the Alarm View and the Event View (in the Console main window). The table size reaches an absolute limit when the number of rows is equal to the value of the two parameters added together minus one. With the next entry, the table is clipped back to the number of rows set by the Clip to nnnn rows value. Subsequent entries will allow it to grow again until the Clip when above is exceeded by nnnn rows limit is reached and the table is again clipped.
- Clip to nnnn rows
- This value sets the number of rows that will remain in the table when the clip limit is exceeded.
- Clip when above is exceeded by nnnn rows
- This value, added to the Clip to nnnn rows setting determines when the table will be clipped (trimmed to the value of Clip to nnnn rows).
- Event Log entry timestamp format
- This option lets you specify the timestamp format used for log entries
in the actual application log files. (This option does not affect the log
entry format displayed in Extreme Management Center client Event Log views.) Select one of the following options:
- Use raw timestamp format – Displays timestamps in a raw non-readable format.
- Use ISO 8601 timestamp format – Displays log entry timestamps in a readable format that makes it easier to view the files in a text file.
- Event and Alarm Table Host/Port Names
- These options let you configure host name and port name resolution, and display the device hostname in the Source column in alarm and event tables:
- Resolve source host names – Select this option to resolve host names to IP addresses and IP addresses to host names, if possible. This option allows you to enable/disable host name resolution for the Event and Alarm tables only. (Host name resolution is enabled globally using the Suite Name Resolution option.)
- Display host name in source column if available
- Resolve port name/alias – Select this option to resolve device port indices to port names and port aliases, and device port names and port aliases to port indices, if possible. This option allows you to enable/disable port name resolution for Event and Alarm tables only. (Port name resolution is enabled globally using the Suite Name Resolution option.)
- Execute Command Script
- The Execute Command Script feature includes script contents in logged events, which is not secure if the script includes passwords. If this option is deselected (default), the script is removed from the logged event. Select this option to include script contents in Execute Command Script events.
Client Connections
Selecting Client Connections in the left panel of the Options window provides the following view where you can configure client connection options.
Click areas in the window for more information.
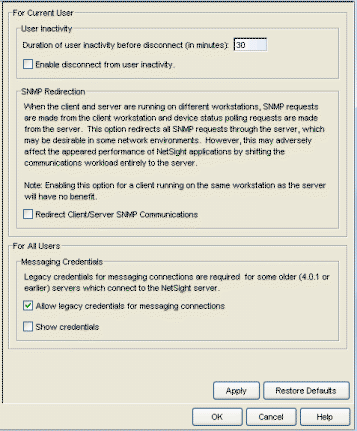
- User Inactivity
- This option specifies a duration of end user inactivity (no keyboard or mouse activity) before the user will be disconnected from the Extreme Management Center Server. If this option is enabled, after the specified amount of time, the end user is disconnected from the Extreme Management Center Server and the application closes. This option applies to the current logged-in user. You must be a member of an authorization group assigned the Server Information > Disconnect Clients capability to configure this option.
- SNMP Redirection
- When a client and server are running on different workstations, SNMP requests are made from the client workstation and device status polling requests are made from the server. Checking this option redirects all SNMP requests through the server. In this configuration, the server uses the same Status Polling settings that would have been used by the client. Redirecting all SNMP requests to the server workstation could adversely affect performance of Extreme Management Center applications. This option applies to the current logged-in user and has no effect when the client and server are running on the same workstation. You must be a member of an authorization group that allows users to configure SNMP Redirection in order to configure this option.
- Messaging Credentials
- Messaging credentials are used for establishing connections between the Extreme Management Center server and Extreme Access Control engines, and the Extreme Management Center server and PCC engines. If your network includes Extreme Access Control and/or PCC engines running version 4.0.1 or earlier, you must enable the "Allow legacy credentials for messaging connections" checkbox. If your engines are version 4.1 or later, disable the checkbox. This option applies to all users. If you change the credentials, you need to configure your PCC engines to use the new credentials. For instructions, see How to Change Messaging Credentials on the PCC Engine in the PCC online Help.
- Show Credentials
- Select this checkbox to view the current messaging credentials. This option applies to all users.
Database Backup
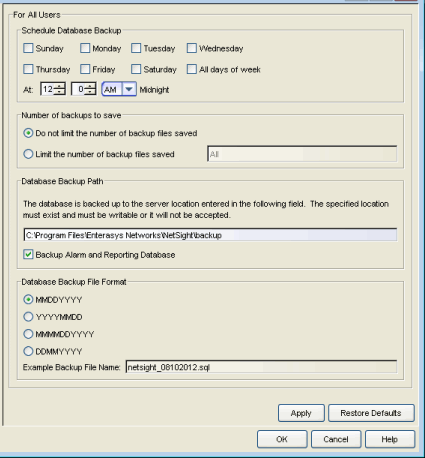
Selecting Database Backup in the left panel of the Options window provides the following view where you can schedule backups of the Extreme Management Center database. An up-to-date database backup is an important component to ensuring that critical information pertaining to all Management Center applications is saved and readily available, if needed.
Select one or more days of the week and specify a time for the backup to be performed. The backup will take place at the same time for each selected day.
You can also specify whether to save all backup files or limit the number of files saved. If you specify a number of files to save, then older backups are removed after a scheduled backup is completed and the limit has been reached.
The database is backed up to the specified directory. Saving backups to a separate location such as a network share ensures that an up-to-date copy of the database is available should a problem such as a server disk failure occur. The backup directory must exist and be writable or it will not be accepted. Both the start and stop of the database backup are logged to the Console Event View log for verification and tracking purposes.
The Backup Alarm and Reporting Database checkbox lets you enable and disable the automatic backup of alarm data and Management Center reporting data. Because the alarm and reporting databases can be quite large, this allows you to control the amount of disk space used by the database backup operation.
You can customize the date and time formats of backup files by selecting the option that formats the date -- day (DD), month (MM), and year (YYYY) -- according to your personal preference.
For more information, see Tuning Database Backup Storage in Performance Tuning section of the Management Center Technical Reference.
Data Display Format
Selecting Data Display Format in the left panel of the Options window provides the following view where you can specify your network mask, MAC address separator, MAC address, and auto group delimiter display options. You can also specify how to display devices in the device tree. These settings apply to the current logged-in user.
Click areas in the window for more information.
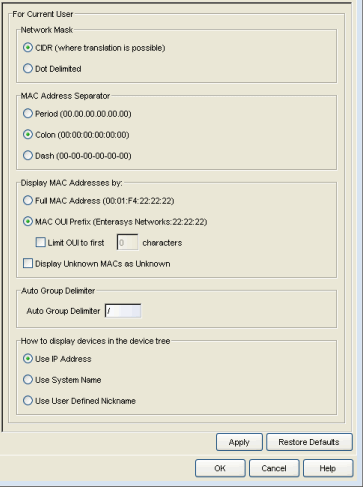
- Network Mask
- Specify one of the following network mask options:
- CIDR (where translation is possible) – Network masks are entered and displayed
using CIDR (Classless Inter-Domain Routing) format. CIDR format uses a slash followed by a number
between 8 and 32, to define the number of contiguous, left-most "one" bits
that define the network mask. For example, /16 for a 16-bit mask.
NOTE: Dot delimited masks without contiguous left-most "one" bits cannot be translated to CIDR. For example, the dot-delimited mask 255.0.255.0 is a valid mask, but cannot be displayed in CIDR format. - Dot Delimited – Network masks are entered and displayed using dotted decimal format. Dotted decimal notation represents IP addresses and network masks as four octets separated by periods. For example, a 16-bit mask in dotted decimal notation is 255.255.0.0.
- CIDR (where translation is possible) – Network masks are entered and displayed
using CIDR (Classless Inter-Domain Routing) format. CIDR format uses a slash followed by a number
between 8 and 32, to define the number of contiguous, left-most "one" bits
that define the network mask. For example, /16 for a 16-bit mask.
- MAC Address Separator
- Specify whether you want MAC addresses displayed with a period (.), colon (:), or dash (-) separator (e.g. 00.00.1D.76.66.66, 00:00:1D:76:66:66, or 00-00-1D-76-66-66).
- Display MAC Addresses by
- Specify how you
want to display end-system MAC addresses in right-panel tables. You can display them as a full
MAC address or with a MAC OUI (Organizational Unique Identifier) prefix. This
allows you to display the associated vendor the MAC address belongs to,
if an OUI mapping exists. You can also limit the vendor name to a
certain number of characters, if desired.
When the Display Unknown MACs as Unknown checkbox is selected, the MAC address for unknown users is displayed as "Unknown" in the End-Systems view. If the checkbox is not selected, the pseudo MAC address assigned to each device is displayed instead of "Unknown" for end-systems learned on an L3 controller.
- Auto Group Delimiter
- This character is used to separate the values that define a device's Contact and Location grouping in the left-panel device tree. Sub-groups in the Grouped By > Contact and Grouped By > Location folders are automatically created based on the Contact and Location values in the Console Properties Tab (Device). This option defines the delimiter that is used to separate those values into groups. For example, using the default delimiter (/), a device's location defined as NewHampshire/Salem/Closet3 will automatically create a hierarchy of three sub-groups under the Grouped By > Location folder.
- How to display devices in the device tree
- Select one of the following options:
- Use IP Address – use the device's IP address.
- Use System Name – use the administratively-assigned name of the device taken from the sysName MIB object.
- Use User Defined Nickname – use the user-defined nickname as defined in the Console Properties Tab (Device).
Date/Time Format
Selecting Date/Time Format in the left panel of the Options window provides the following view where you can customize the date and time formats to your own personal preference. These settings will apply to the current logged-in user.
Click areas in the window for more information.
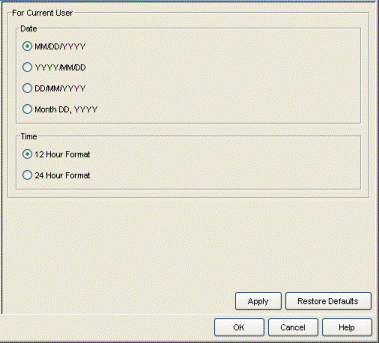
- Date
- Select the option that formats the date – day (DD), month (MM), and year (YYYY) – according to your personal preference.
- Time
- Select the option that formats the time – 12-hour or 24-hour clock – according to your personal preference.
Diagnostic Configuration
Selecting Diagnostic Configuration in the left panel of the Options window provides the following view
where you can configure the level of information collected in client-side
diagnostic logs. The information collected in these logs can be used for
troubleshooting purposes. Each Extreme Management Center application has its own log. The
diagnostic information is recorded in the log for the application you are
currently working in. The logs are located in the following directory:
Windows:
\Documents and Settings\<user home directory>\Application Data\NetSight\logs
Linux:
~/NetSight/logs
The table in this Options view lists the Extreme Management Center applications and various Extreme Management Center components, and lets you configure the level of information to be collected for each one. Select the desired applications and/or components and use the Table Editor to set the level of diagnostic information to collect.
Click areas in the window for more information.
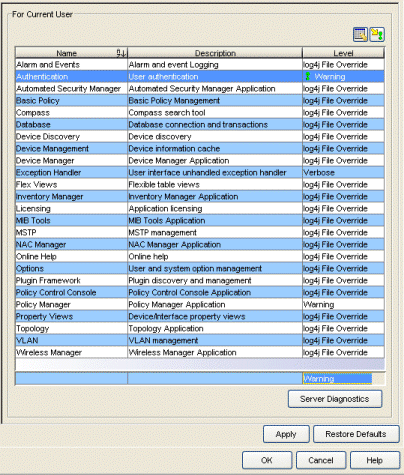
- Name and Description
- The name of the Extreme Management Center application or component and a brief description.
- Level
- The level of information that will be collected in the logs for the
selected Extreme Management Center applications and/or components. Use the Table Editor to
change the level. Select the row(s) you would like to edit, and toggle the
Show/Hide Table Editor button
 to display the Table Editor row at the bottom of the table. In the Table
Editor row, click on the last column and use the drop-down list to select
the desired level:
to display the Table Editor row at the bottom of the table. In the Table
Editor row, click on the last column and use the drop-down list to select
the desired level:- Restore Defaults – restores the level to its factory default setting.
- log4j File Override – sets the level to the level specified in the log4j.properties file.
- Off – turns off all diagnostic logging.
- Critical – records only Error events.
- Warning – records Warning and Error events.
- Informational – records Warning, Error, and Info events.
- Verbose – records debug information in addition to Warning, Error, and Info events.
CAUTION: The Informational and Verbose settings will create large log files and may impact system performance. - Once you have selected a new level, a green exclamation mark
( marks the cells that have been changed (but not Applied) and the )
)  Apply
button becomes active. Click Apply
  to apply the changes to the table.
-
 Show/Hide Table Editor
 - This button toggles the Table Editor, a row at the bottom of the
table that allows you to select the desired level for selected log. Click on the
last column in the
editor row and use the drop-down list to select the desired level. Click Apply
 to apply the changes to the table.
- Server Diagnostics
- Opens the Administration web page where you can select the Server Diagnostics tab and specify diagnostic configuration levels for server-side diagnostics.
ExtremeNetworks.com Update
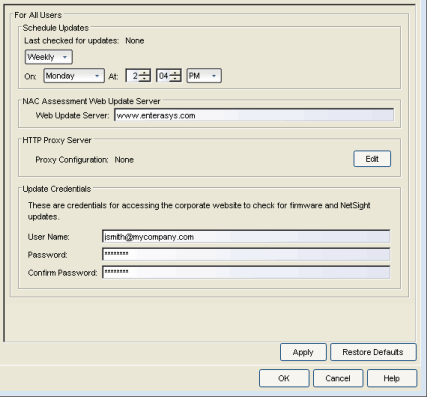
Selecting ExtremeNetworks.com Update in the left panel of the Options window provides the following view where you can configure options for accessing the ExtremeNetworks.com website to obtain information about the latest Extreme Management Center product releases and Extreme Networks firmware releases available for download. These settings apply to all users. You must be a member of an authorization group that includes the "Request and Configure ExtremeNetworks.com Support" capability in order to configure these options.
Click areas in the window for more information.
- Schedule Updates
- This section lets you schedule a specific times to check for Extreme Management Center software updates. Use the drop-down list to set the frequency (Daily, Weekly, Disabled) for checking for updates. If you have specified a Weekly check, use the drop-down list to select the day of the week you wish the check to be performed, and set the desired time. If you have specified a Daily update, set the desired time.
- Extreme Access Control Assessment Web Update Server
- Displays the web update server used by NAC Manager to update Extreme Access Control assessment server software. This update operation pertains only to Extreme Access Control on-board agent-less assessment servers.
- HTTP Proxy Server
- If your
network is protected by a firewall, click the Edit button to open the
Edit Proxy Settings window. Select the Specify Proxy Server checkbox and enter your proxy server
address and port ID. Consult your network administrator for this
information. If your proxy server requires authentication, select the Proxy
Authentication checkbox and enter the proxy username and password
credentials. The credentials you add here must match the credentials
configured on the proxy server. Proxy credentials are cached once used
successfully. If you change them here, it is recommended that you restart
the Extreme Management Center Server to clear the old credentials from the cache.
| NOTE: | The update procedure uses these proxy settings only when necessary, otherwise the settings are ignored. |
|---|
- Update Credentials
- Enter the credentials used to access the ExtremeNetworks.com website to obtain firmware and Extreme Management Center update information. You need to create an account at ExtremeNetworks.com and define a user name and password for the account, then enter the same credentials here.
MAC OUI Vendor List
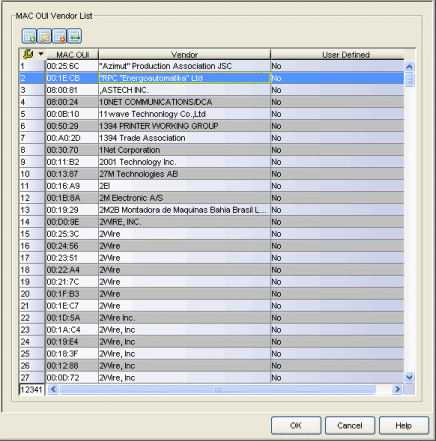
Selecting MAC OUI Vendor List in the left panel of the Options window displays the IEEE OUI and Company_id Assignments public mapping list, and lets you update and modify the list. For example, you can update the list to the latest version from the IEEE website, and if you have devices that do not have an OUI (Organizational Unique Identifier), you can add your own vendor entries.
Click areas of the graphic for more information.
-

- Use these buttons to add, edit, or delete MAC OUI vendors, or update the MAC OUI Vendor list from either the IEEE website or a file.
Name Resolution
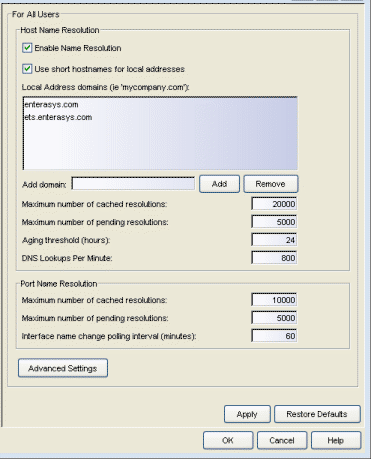
Selecting Name Resolution in the left panel of the Options window displays options related to host name and port name resolution.
Click areas of the graphic for more information.
Host Name Resolution
Use this section to set options for resolving host names to IP addresses and IP addresses to host names.
- Enable Name Resolution
- This option allows host names to be displayed in place of IP addresses throughout Management Center. This feature is primarily used by NetFlow. With name resolution enabled, flow data would show "Client=rsmith-ws Server=proxy-usa", rather than "client=10.20.0.2 server = 10.20.0.1". The option is off by default because name resolution can add additional load on the network’s DNS server.
- Use short hostnames for local addresses
- This option is enabled by default when hostname resolution is enabled, and applies to Management Center only. When enabled, the hostname cache will remove the fully qualified hostname's domain if it matches one of the specified local address domains. For example, "jsmith-ws.mycompany.com" would display as "jsmith-ws" if mycompany.com is listed as a local address domain. This option can be disabled when troubleshooting problems with hostname resolution, or if IP addresses are preferred.
- Local address domains
- Use the Add Domain field to create a list of home domains
that will be deleted from a local hostname when it is added to the
hostname cache. You can add multiple home domains when subdomains are
defined for your network. This option applies to Management Center only.
The first time the hostname cache service is started, if the Local address domains list has not been defined, Management Center attempts to auto-populate it by resolving the IP address of the Management Center server. If it resolves to a subdomain, Management Center creates multiple entries for all subdomains but the root domain (.com). If it cannot do this successfully, the list will not be populated.
- Maximum number of cached resolutions:
- The maximum number of IP/hostname pairs that can be cached in memory. This number can be adjusted to control the amount of memory used by this service.
- Maximum number of pending resolutions:
- The maximum number of hostname resolution requests that can be queued up. This number can be adjusted to control the maximum amount of time spent waiting for a resolution.
- Aging threshold (hours):
- This option determines how long IP/hostname pairs will be cached in memory. After the aging threshold time has passed, the IP/hostname pair is removed from the cache in order to prevent stale IP-hostname associations. This option addresses the fact that DHCP assigns a new IP address to users frequently, especially on reboots. Without an aging threshold, hostnames will continue to be associated to the IP they had at the first lookup. The default value is 24 hours; the minimum value is 1 hour.
- DNS Lookups Per Minute:
- The maximum number of hostname lookups that the DNS server can perform each minute. This prevents hostname resolution from using so many resources on a switch that switching of real traffic is affected.
Port Name Resolution
Use this section to set options for resolving device port indices to port names and port aliases, and device port names and port aliases to port indices.
- Maximum number of cached resolutions:
- The maximum amount of port data that can be cached in memory. This number can be adjusted to control the amount of memory used by this service.
- Maximum number of pending resolutions:
- The maximum number of port name resolution requests that can be queued up. This number can be adjusted to control the maximum amount of time spent waiting for a resolution.
- Interface name change polling interval:
- This setting specifies how often the port name resolution service checks devices to see if port information has changed.
- Advanced Setting
- Click the Advanced Settings button to open the Name Resolution Advanced Settings Options window.
Extreme Management Center Feedback Program
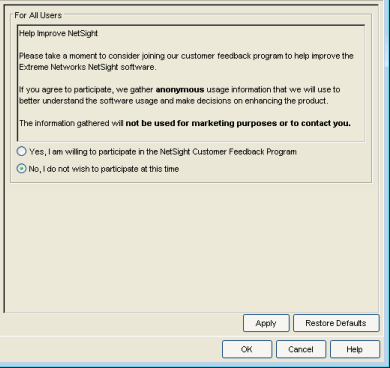
This option allows you to enable or disable participation in the Extreme Management Center Customer Feedback Program. If you participate, Extreme Management Center gathers anonymous usage information to better understand how Extreme Management Center software is used and to make decisions on enhancing the product. This bi-directional communication with ExtremeNetworks.com also enables features for you such as the ability to get best practices firmware configurations, find the latest firmware updates based on your own network, create Support cases directly from Extreme Management Center that automatically upload troubleshooting information, and more.
The information gathered will not be used for marketing purposes or to contact you.
Extreme Management Center Server Health
Selecting Extreme Management Center Server Health in the left panel of the Options window provides the following view, from which you can configure warnings to help monitor the NetSight server health.
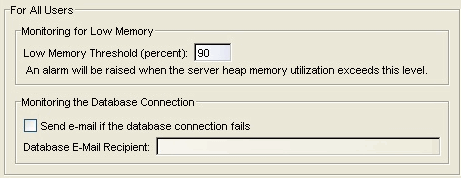
- Low Memory Threshold (percent)
- Enter a percentage to specify the server heap memory utilization percentage above which an alarm is raised. If the memory utilization falls more than five percent below the threshold percentage, the alarm is automatically cleared.
- Send e-mail if the database connection fails
- Select the checkbox and enter an email address to send an email notification if the Extreme Management Center database goes down and when the database comes back up.
Network Monitor Cache
The network monitor cache stores information about the physical topology of a device, with additional emphasis on port information. Data is pulled from multiple places including slot and port details (Entity, ifTable), default role (Policy), neighbor link details (CDP, EDP, LLDP), Ethernet Automatic Protection Switching (EAPS), and Multi System Link Aggregation (MLAG).
The cache is maintained in a two-tiered structure: device physical data is cached to the database and a fast in-memory cache maintains a subset of this data in memory on the server. The in-memory cache can contain all or a subset of devices stored in the database.
On the specified polling interval, the data is validated and automatically updated as necessary. Decreasing the poll interval will increase background SNMP performed by the server.
Storing this information greatly improves performance for views in Extreme Management Center that request it. The cache should generally be left enabled for the best experience.
Click areas in the window for more information.
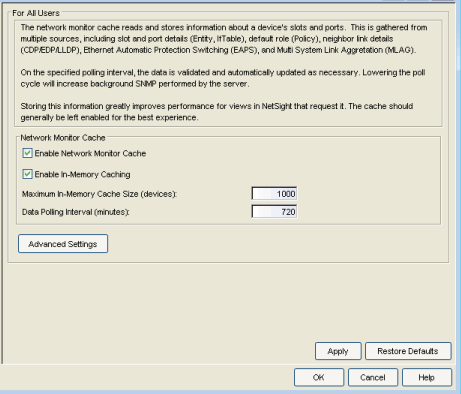
Use this option to enable or disable the network monitor cache. Enabling the cache improves performance for Extreme Management Center views that request this information.
Use this option to enable or disable the In-Memory Cache. To limit memory usage, you can disable the In-Memory Cache and have the Device Cache rely directly on the database.
The maximum number of devices whose data will be stored in the In-Memory Cache. This option lets you adjust the amount of memory the cache will use.
The frequency (in minutes) that the device data is checked for changes. If the device data is stale, the data is refreshed in the cache. Reducing the interval will increase background SNMP performed by the server.
Opens a window where you can set network monitor cache advanced options.
- Maximum number of SNMP worker threads. The cache is populated with results from SNMP queries to devices. If multiple devices are added to the cache at the same time, this number determines the maximum number of threads that can send SNMP queries in parallel.
- Per-Feature polling overrides. Allows you to set unique polling intervals for individual cache features that should be polled more frequently. Set to 0 to use the interval set for the Data Polling Interval.
Port Monitor
Selecting Port Monitor in the left panel of the Options window provides the following view where you can specify Port Monitor display options. These settings will apply to the current logged-in user.
Click areas of the graphic for more information.
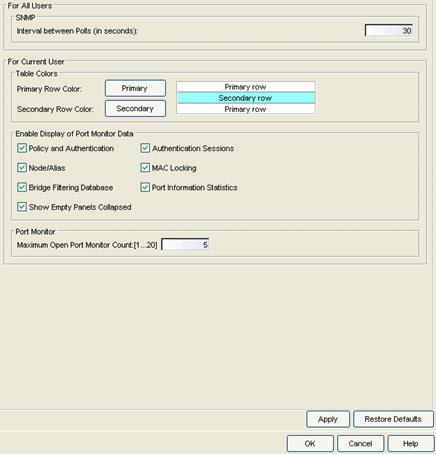
- Table Colors
- Use the buttons to select the primary and secondary row colors you want to display in tables. A sample of your selection will be displayed in the sample table scheme to the right of your selections.
- Enable Display of Port Monitor Data
- Use the checkboxes in this section to determine what data will be displayed for a Port Monitor session. If the Show Empty Panels Collapsed checkbox is selected, panels without information will be collapsed so those panels with information are easier to view.
- Maximum Open Port Monitor Count
- Specify the maximum number of Port Monitor windows that can be open at one time. If too many windows are open at one time, system operation may be impacted. The default setting is 5.
Services for Extreme Management Center Server
Selecting Services for Extreme Management Center Server in the left panel of the Options window provides the following view where you can specify your TFTP settings. These settings apply to all users. You must be assigned the appropriate user capability to configure these options.
Click areas of the window for more information.
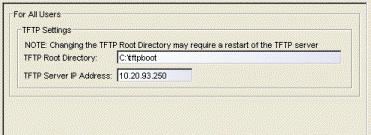
- TFTP Root Directory
- You must specify a TFTP root directory, whether you are using the Extreme Management Center TFTP server or another TFTP
server. The root directory is the base directory to which the TFTP server is allowed access. The
TFTP server will be allowed to create files to or read files from this
directory and any of its subdirectories. Use the default root directory,
or if you would like to use an alternate root directory, enter a path to
that directory in this field or use the Browse
button to navigate to the directory.
Changing the TFTP root directory may require restarting the TFTP server.
NOTE: If you are using a TFTP server other than the Extreme Management Center TFTP service, keep in mind the following requirements when setting the path to your root directory: - If your TFTP server is configured with a TFTP root directory, it must match the root directory entered here.
- If your TFTP server is not configured with a TFTP root directory, change the TFTP root directory here to the root of the drive (e.g. C:\ or D:\).
- If you are using a TFTP server on a remote system,use the Universal Naming Convention (UNC) when specifying the root
directory path. The UNC convention uses two slashes // (Linux systems)
or backslashes \\ (Windows systems) to indicate the name of the system, and one
slash or backslash to indicate the path within the computer. For example, on a Windows
system, instead of using
h:\ (where h:\ is mapped to the tftpboot directory on the remote drive)
use
\\yourservername\tftpboot\
- TFTP Server IP Address
- If the TFTP server resides on a remote system, or if the local system is configured with multiple IP addresses, enter the IP address for the TFTP service here. This field accepts both IPv4 and IPv6 addresses.
SMTP E-Mail Server
Selecting SMTP E-Mail Server in the left panel of the Options window provides the following view where you can specify the SMTP E-Mail server that will be used by the Extreme Management Center E-Mail notification feature. The E-Mail notification feature is used in Console's alarm action configuration, as well as in Inventory Manager's Capacity Planning report scheduling and in Automated Security Manager actions. These settings apply to all users. You must be assigned the appropriate user capability to configure these options.
Click areas of the window for more information.
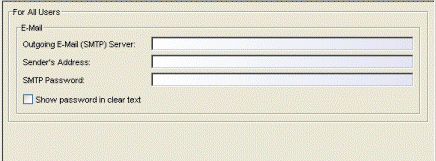
- Outgoing E-Mail (SMTP) Server
- Identifies the SMTP (E-Mail) server that should be used for outgoing messages generated by the E-Mail notification feature.
- Sender's Address
- The sender's address that is inserted in outgoing E-Mail notification messages. The address should be in a fully qualified format such as "sender's name@sender's domain."
- Show password in clear text
- When checked, the password is shown in text. When unchecked, the password is shown as a string of asterisks.
Status Polling
Selecting Status Polling in the left panel of the Options window provides the following view where you can specify options for polling devices in the left-panel device tree. Console uses the polling options and poll groups defined here to contact the devices and update tree information. When a device is added to the Extreme Management Center database using the Add Device menu option or a Console CDP Seed IP Discover, it is added to the default poll group selected here. (A Console IP Range Discover lets you assign devices to any of the three poll groups.) You can then reassign individual devices or device groups to a different poll group using the Access view in the Console Properties tab. These settings apply to all users. You must be assigned the appropriate user capability to configure these options.
Optimal Poll Intervals
There are three distinct poll groups, and each device belongs to one of the three groups. This lets you poll critical devices at a more frequent interval, while polling non-essential devices less frequently.
The overall density of polling is controlled by the Maximum number of devices to contact at once setting. This determines the maximum number of devices from each group that can be polled at any given time. Console always attempts to poll up to the maximum number of devices until all of the devices in the three groups have been polled. As responses are received and devices are removed from the poll queue, other devices are added to the queue. Once all the devices have been polled, Console stops polling and batches information to update clients.
If the Maximum number of devices to contact at once is too high, such that the poll density is too high, system performance will degrade quickly. The optimal poll setting is dependent on many factors including but not limited to CPU speed, RAM, and network devices. As the number of devices that you are polling increases, the poll density (Maximum number of devices to contact at once) should be reduced to increase performance.
The default Maximum number of devices to contact at once setting and poll group intervals provided as defaults are a good starting point. If necessary, adjust the values to optimize status polling for your network.
Click areas of the window for more information.
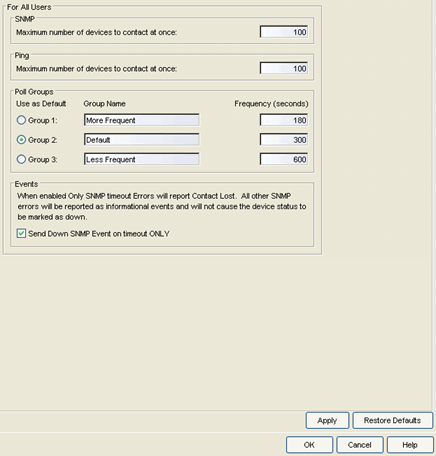
SNMP
These status polling options pertain to devices whose poll type is set to "SNMP."
- Maximum number of devices to contact at once.
- The maximum number of IP addresses that Console will attempt to contact simultaneously.
Ping
These status polling options pertain to devices whose poll type is set to "Ping."
- Number of Ping Retries
- The number of attempts that will be made to ping a device. The default setting is 3 retries, which means that Console retries a timed-out request three times, making a total of four attempts to contact a device.
- Length of Ping Timeout (in seconds)
- The amount of time (in seconds) that Console waits before re-trying to ping a device. The default setting is 3 seconds. The maximum setting is 20 seconds.
- Maximum number of devices to contact at once.
- The maximum number of IP addresses that Console will attempt to contact simultaneously.
Poll Groups
There are three poll groups that each define a unique poll frequency. The poll frequency
for each group specifies the actual length of the poll cycle in seconds. The interval for
individual poll groups can be set according to your network's needs using the guideline
under Optimal Poll Intervals.
Select one group as the default poll group. When a device is added to the Extreme Management Center database using the Add Device
menu option or a CDP Seed IP Discover, it is added to the default poll group selected here. (IP Range Discover
lets you assign devices to any of the three poll groups.) You can also assign individual devices or device
groups to a specific poll group using the Access view in Console's Properties
tab.
Events
When this option is selected, only SNMP timeout errors will result in a "Contact Lost" device status. All other SNMP errors will be reported as informational events in the Console Event Log and will not cause the device status to be marked as "down" with a red down arrow.
System Browser
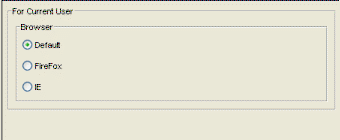
Selecting System Browser in the left panel of the Options window provides the following view where you can specify the web browser for Extreme Management Center to use when launching web pages from Extreme Management Center applications. The browser selections displayed depend on the web browsers installed on your system. Select Default to specify the system default browser. This setting applies to the current logged-in user.
Trap Configuration
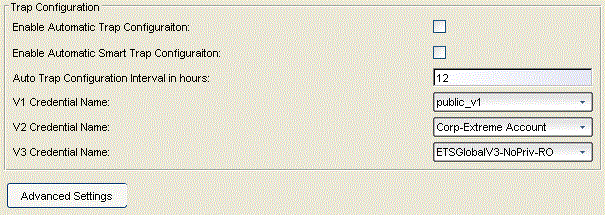
Selecting Trap Configuration in the left panel of the Options window provides the following view where you can configure traps to be automatic traps or automatic smart traps. Additionally, you can configure the amount of time in hours between automatic trap configurations as well as select credential names. Clicking Advanced Settings opens the Trap Configuration Advanced Settings window.
Tree
Selecting Tree in the left panel of the Options window provides the following view where you can specify whether a warning message will be displayed when performing drag and drop operations on devices and device groups in the network elements tree. For example, if you drag a device in the tree to a user-defined folder, the warning appears asking if you are sure you want to drop the selected device into this folder. This warning allows you to verify that you do indeed want to perform a drag and drop operation to that folder, and prevents you from inadvertently moving devices. However, if you find it annoying to have the warning appear each time you do a drag and drop operation, you can deselect the option. This setting applies to the current logged-in user.

Web Server
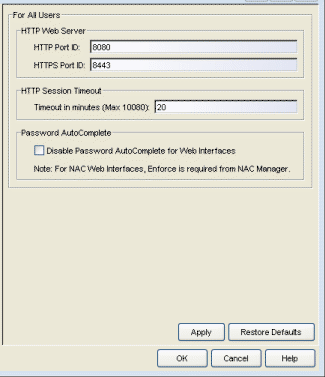
Selecting Web Server in the left panel of the Options window provides the following view where you can specify the HTTP and HTTPS port ID for HTTP web server traffic. This port must be accessible through firewalls for users to install and launch Management Center client applications. By default, Management Center uses port ID 8080 (HTTP) and 8443 (HTTPS). If you change the port ID, you must restart the Management Center Server for the change to take effect.
The HTTP Session Timeout option lets you specify a session timeout value for all Management Center web-based views, such as Management Center web pages and Console FlexViews.
The Password AutoComplete option lets you disable automatic password completion for users logging into Management Center web interfaces. Note that for Access Control web interfaces, you must enforce from NAC Manager for the option to take effect.
These settings applies to all users. You must be assigned the appropriate user capability to change this setting.
For information on related tasks: