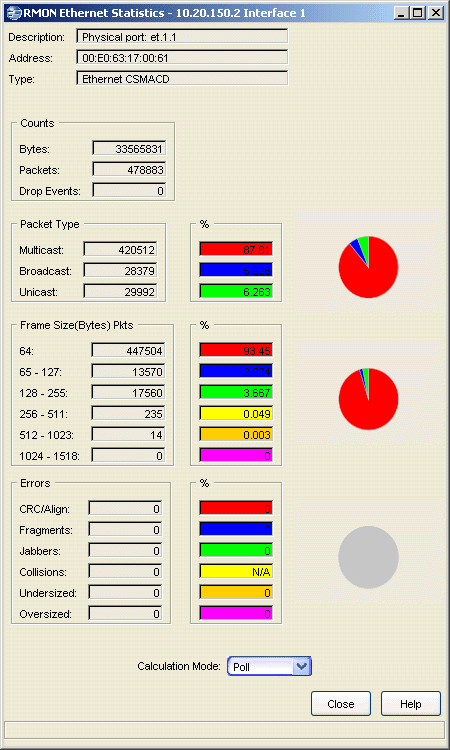
RMON Ethernet Statistics Window
Use this window to view a detailed statistical breakdown of traffic on the monitored Ethernet network segment. When viewing this window, keep in mind that the data provided applies only to the interface or network segment. If you reset your device, close and re-open this window to refresh the values.
To access the RMON Ethernet Statistics window from Device Manager, click on the desired port in the Device View and select RMON Ethernet Statistics from the port menu. To access this window from Console, select the desired port in the Port View of the Properties tab or in a FlexView table, and use the right-click menu option.
Click the graphic for more information.

- Description
- Displays a description of the port and the type of interface followed by the board and port number.
- Counts
- Displays the total number of bytes and packets processed on the network
segment and the total number of packets dropped.
- Bytes -- Displays the total number of bytes contained in packets processed on the network segment. This number includes bytes contained in error packets.
- Packets -- Displays the total number of packets processed on the network segment. This number includes error packets.
- Drop Events -- Displays the number of times packets were dropped because the device could not keep up with the flow of traffic on the network. (This value reflects the number of times packets were dropped not the actual number of packets.)
- Packet Type
- Displays the total number and percentage of good packets transmitted on the network segment that were Multicast, Broadcast, and
Unicast. The pie chart presents a graphical view of the percentage breakdown and
the colors in the pie chart correspond to the colors in the percentage
display boxes.
- Multicast -- Displays the number of good packets processed on the network segment that were destined for more than one address. This total does not include broadcast packets. The number under the percentage column indicates what percentage of good packets transmitted on the network segment were multicast.
- Broadcast -- Displays the number of good packets processed on the network segment that had the broadcast (FF-FF-FF-FF-FF-FF) destination address. The number under the percentage column indicates what percentage of good packets transmitted on the network segment were broadcast.
- Unicast -- Displays the number of good packets processed on the network segment that were destined for a single address. The number under the percentage column indicates what percentage of good packets transmitted on the network segment were unicast.
- Frame Size (Bytes) Pkts
- Displays the number of packets (including error packets) within these lengths (excluding framing bits but including frame check sequence bits) processed by the network segment. The pie chart presents a graphical view of the percentage breakdown and the colors in the pie chart correspond to the colors in the percentage display boxes.
- Errors
- Displays the type and number of problem packets processed by the network
segment. The pie chart presents a graphical view of the percentage
breakdown and the colors in the pie chart correspond to the colors in the
percentage display boxes.
- CRC/Align -- Displays the number of packets processed by the network segment that had a non-integral number of bytes (alignment error) or a bad frame check sequence (Cyclical Redundancy Check (CRC) error).
- Fragments -- Displays the number of packets processed by the network segment that were undersized (less than 64 bytes in length (runt)) and had either a non-integral number of bytes (alignment error) or a bad frame check sequence (CRC error).
- Jabbers -- Displays the number of packets processed by the network segment that were oversized (greater than 1518 bytes (giant)) and had either a non-integral number of bytes (alignment error) or a bad frame check sequence (CRC error).
- Collisions -- Displays the total number of receive (those the device detects while receiving a transmission) and transmit (those the device detects while transmitting) collisions detected on the network segment. The percentage field for Collisions will always display N/A because collisions are not true errors; percentages are not calculated, and will not be represented in the pie chart.
- Undersized -- Displays the number of packets processed by the network segment that contained fewer than 64 bytes (runt packets), but were otherwise well-formed.
- Oversized -- Displays the number of packets processed by the network segment that contained more than 1518 bytes (giant packets), but were otherwise well-formed.
- Calculation Mode
- Use the drop-down list to specify how the statistics count will be calculated:
- Poll -- After the completion of the current polling cycle plus one complete polling cycle, the window will display the total count of statistics processed since the device was last initialized. These totals are updated after each polling cycle.
- Delta -- After the completion of the current polling cycle plus two more polling cycles, the window will display the count of statistics processed during the last polling interval. These counts will be refreshed after each polling cycle.
- Accumulate -- After the completion of the current polling cycle plus two more polling cycles, the window will display a fresh cumulative count of statistics. This option does not clear the device counters; you can still re-select Poll for the total count since the device was last initialized.
For information on related windows: