RMON Long Term History Window
The RMON Long Term History window displays an individual long term history file selected from the RMON Long Term History List window.
The long term history function automatically saves data from a device's history table to a comma separated variable file (*.csv) on the client workstation. The data can then be viewed in this window, or imported into any database or spreadsheet software that accepts comma-delimited data. With Long Term History, it is not necessary to manually export data (via the Export button in the RMON History window).
| NOTE: | The
RMON History List window
must remain open for the history data to
be saved to the .csv file. |
|---|
To access this window, select the desired history table file in the RMON Long Term History List window, and click View.
RMON history statistics can be viewed in numerical (Table view) or graphical (Graph view) format by selecting the appropriate tab:
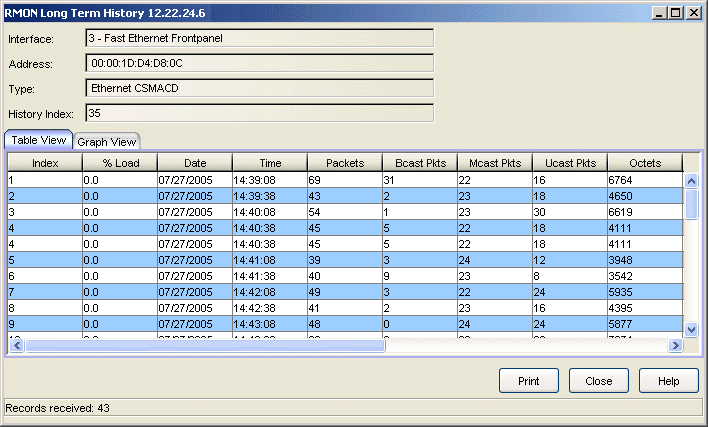
Table View
Selecting the Table View tab displays the long term history statistics in a numerical format. Console provides table options and tools that let you customize table settings and find, filter, sort, print, and export information in a table. You can access these Table Tools through a right mouse click on a column heading or anywhere in the table body. For more information, see Table Tools.
Click the graphic for more information.

Displays a list of network statistics collected at user-defined intervals in a numerical format.
- Index
- Displays a number that uniquely identifies each history table entry. The first entry -- collected at the appropriate interval after the device was initialized -- is indexed with a 1. Regardless of the maximum number of entries defined for the table, the index continues to increment until the device is reset. However, if a history table is modified so that the interval and/or duration change, the long-term history of that table will continue to store all data, but the Index column will reset to 1 with the first snapshot under the new parameters.
- Time
- Displays the time the sample was taken. This time reflects the beginning of the sampling interval (e.g., a time value of 8:59:13 on the 30 second table indicates that the statistical data was collected from 8:59:13 to 8:59:42).
- Packets
- Displays the total number of packets received during the sample interval. This number includes error packets.
- Bcast Pkts
- Displays the number of good packets received during the sample interval that had the broadcast (FF-FF-FF-FF-FF-FF) destination address.
- Mcast Pkts
- Displays the number of good packets received during the sample interval that were directed to a multicast address. This total does not include broadcast packets.
- Ucast Pkts
- Displays the number of good packets received during the sample interval that were directed to a single address.
- Octets
- Displays the total number of octets, or bytes, received during the sample interval. This number includes octets contained in error packets.
- Drop Events
- Displays the number of times during the sample interval that packets were dropped because the device could not keep up with the flow of traffic on the network segment. This value reflects the number of times packets were dropped.
- CRC Align
- Displays the number of packets received during the sample interval that had a non-integral number of bytes (alignment error) or a bad frame check sequence (Cyclic Redundancy Check (CRC) error).
- Undersize
- Displays the number of packets received during the sample interval that contained fewer than 64 bytes (runt packets), but were otherwise well-formed.
- Oversize
- Displays the number of packets received during the sample interval that contained more than 1518 bytes (giant packets), but were otherwise well-formed.
- Fragments
- Displays the number of packets received during the sample interval that were undersized (less than 64 bytes in length; a runt packet) and had either a non-integral number of bytes (alignment error) or a bad frame check sequence (CRC error).
- Jabbers
- Displays the number of packets received during the sample interval that were oversized (greater than 1518 bytes; a giant packet) and had either a non-integral number of bytes (alignment error) or a bad frame check sequence (CRC error).
- Collisions
- Displays the total number of receive (detected while the device was receiving a transmission) and transmit (detected while the device was transmitting) collisions detected on the network segment during the sample interval.
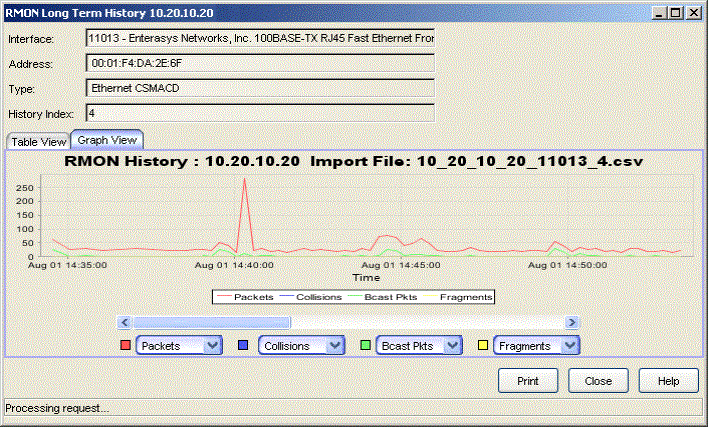
Graph View
Selecting the Graph View tab displays the history statistics in a graph format. As many as four variables can be displayed in the graph at once. Use the drop-down lists to select the desired variables.
| NOTE: | The selected variable with the largest value controls the scale, making it
difficult to graph variables with large values at the same time as variables with
small values. If you have difficulty displaying error-type variables, which
typically have low values, use the Nothing selection as one or more of your
variables. |
|---|

Displays a graph of network statistics collected at user-defined intervals.
- Number of Units
- Displays the number of units counted for each of the selected variables during the specified interval.
- Time
- Displays the date and time the sample was taken. The time reflects the beginning of the sampling interval (e.g., a time value of 8:59:13 on the 30 second table indicates that the statistical data was collected from 8:59:13 to 8:59:42).
- Drop-down Lists
- Use the four drop-down lists to select the variables to be displayed
in the graph: Drop Events, Octets, Packets, Bcast Pkts,
Mcast Pkts, Ucast Pkts,
CRC Align, Oversize,
Undersize, Fragments,
Jabbers, Collisions,
% Load, or Nothing.
To the left of the drop-down list is the variable's corresponding line color.
NOTE: The selected variable with the largest value controls the scale, making it difficult to graph variables with large values at the same time as variables with small values. If you have difficulty displaying error-type variables, which typically have low values, use the Nothing selection as one or more of your variables.
For information on related tasks: