A threshold alarm is a network alarm that is triggered when a specified value enters an unacceptable range, for example, when CPU utilization exceeds 80% or when an application exceeds 10 GB in an hour. The Edit Threshold window lets you define the threshold value used to trigger a threshold alarm.
Use the Alarms Manager window to create your threshold alarm definition, and then use this window to identify the type of threshold, select the statistic to monitor, and specify the threshold value that triggers the alarm.
There are two threshold alarm types: OneView and Application Analytics. A OneView threshold alarm is based on reporting data monitored by the OneView Collector. An Application Analytics threshold alarm is based on application usage data collected on the Application Analytics engine.
You must have statistics collection and flow collection enabled for your network devices in order to collect the data used to determine whether a threshold has been passed. See Enable Report Data Collection and Enable Flow Collection in the Management Center Getting Started Help topic for instructions. To use Application Analytics threshold alarms, you must be using Application Analytics.
For information on how to clear OneView and Application Analytics alarms, see How to Clear Threshold Alarms.
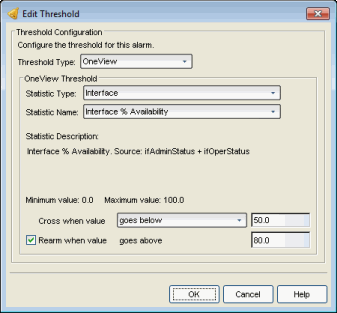
OneView Threshold Alarm
The OneView Collector gathers historical reporting data over time, which is then used in Management Center reports. Threshold alarms are raised when the reporting data matches a threshold alarm criteria.
Click areas in the window for more information.

Select OneView as the threshold type.
Select the type of statistic to monitor.
Select the statistic to monitor. The list of statistics varies depending on the Statistic Type that is selected. See a description of the selected statistic in the field below the statistic name.
A description of the selected statistic is displayed, as well as the source of the statistic.
The minimum and maximum values allowed for the selected statistic (if applicable).
Select the crossing direction and specify the statistic value. A rising threshold triggers the alarm when the statistic goes above the specified value. A falling threshold triggers the alarm when the statistic goes below the specified value. If you’re configuring a clearing alarm, specify the value that clears the alarm here.
If you select the re-arming checkbox, the threshold alarm will clear itself when the monitored statistic is restored to an acceptable range. When an alarm self-clears, no action is triggered. Enter a value that will be used to determine when the threshold alarm will clear itself. The value should be close, but not too close, to the threshold value. If the value is too close to the threshold value, then run-time values that hover around the threshold value can trigger and clear alarms too frequently, resulting in noisy alarm activity.
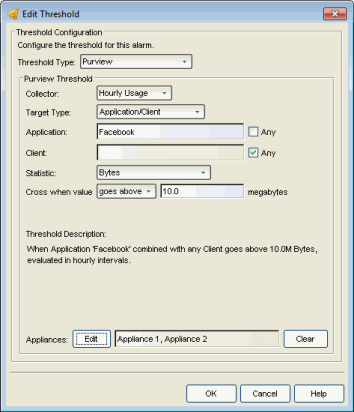
Application Analytics Threshold Alarm
The Application Analytics engine generates Application Analytics threshold alarms as part of the application usage collection process. Threshold alarms are raised when hourly or high-rate usage data matches a threshold alarm criteria. Each target record produced on the Application Analytics engine is evaluated at the end of each collection interval to see if it matches alarm criteria. If a statistic has crossed a configured threshold, an alarm in raised.
Alarms can track single target types as well as target combinations. They can reference specific targets, for example a specific application such as Facebook, or they can reference all the targets in a target type, for example all applications. Only the target types and target combinations that are collected by Application Analytics can be used in alarms.
Here are some examples of possible Application Analytics threshold alarms:
- Raise an alarm when the BitTorrent application exceeds 10 GB in an hour.
- Raise an alarm when any iOS application exceeds 1 GB uploaded in an hour.
- Raise an alarm when any client uses more than 50 applications in a 5-minute interval.
- Raise an alarm when there are more than 10,000 servers detected in an hour.
- Raise an alarm when the Outlook application's average response time is more than 5 seconds in an hour.
Click areas in the window for more information.

Select Application Analytics as the threshold type.
Application Analytics application usage data is collected in hourly and in high-rate (five-minute) intervals. Set the collector to use the interval that you would like data checked. Some target types are not available when the high-rate collector is selected.
| NOTE: | Application Analytics hourly threshold alarms are not triggered until the hourly calculation, and high-rate threshold alarms are not triggered until the end of the high-rate interval. For example, if there is excessive network usage at 3:05, the hourly threshold alarm will not be triggered until the hourly total is calculated at 4:00. |
Select the target type that you want the alarm to monitor. Options includes single targets as well as target combinations. Only the target types that are collected by Application Analytics can be used in alarms.
Depending on the target type you select, you can choose to limit the alarm testing to a specific target instance by entering a target name in the applicable field, or you can test for all instances by selecting the "Any" checkbox.
Alarms will be raised for all targets that match the alarm. The name of the specific target that matched will be included in the alarm message.
- Applications - An application identified in Application Analytics, such as Facebook.
- Application Groups - Application categories, such as Cloud Computing or Social Networking.
- Clients - The end-point of a flow which has the client role for that connection.
- Servers - The end-point of a flow which has the server role for that connection.
- Locations - The network location for the client of an application flow. For more information, see Network Locations.
- Device Families - The kind of device determined for a client, such as Windows or iOS.
- Profiles - A profile assigned to a client.
- Application/Client - Information about applications used by clients, or about clients using an application.
- Application/Device Family - Information about applications used by device families.
- Application/Profile - Information about application use within a profile.
- Total - The total accumulated statistics for the interval, collected from all network flows (with the exception of client count, server count, and application count statistics, which are collected from in-network flows).
- Total - All Flows - Client count and server count statistics collected from all network flows.
Select the statistic that you want the alarm to monitor. Options vary depending on the selected target type. The final statistic value at the end of the interval is what is tested against the threshold value.
- Bytes - The number of bytes transferred in both directions, between the client and the server. Also known as bandwidth. You can track sent and received bytes as well as total bytes. Examples:
Facebook exceeds 100 MB in an interval.
Any client exceeds 100 MB uploaded in an interval.
Any client exceeds 1 GB downloaded in an interval. - Flows - The number of NetFlow records sent by the switch to report the traffic between the client and the server. You can track inbound and outbound flows as well as total flows. Example:
Any client has at least 1 BitTorrent flow. - Clients - The number of unique clients associated with the target. Example:
There are more than 10 clients in profile "Unregistered Guests". - Servers - The number of unique servers associated with the target. Example:
There are more than 10,000 servers detected in an hour. - Applications - The number of unique applications associated with the target. Example:
A client uses more than 50 applications in a 5-minute interval. - Network Response Time - The average amount of time to create a connection. Example:
Any location has an average network response time of 10 seconds or more during an hour. - Application Response Time -The average amount of time for a server to respond to a request. Example:
Any application has an average application response time of 10 seconds or more during an hour.
Select the crossing direction and specify the statistic value. A rising threshold triggers the alarm when the statistic goes above the specified value. A falling threshold triggers the alarm when the statistic goes below the specified value. If you’re configuring a clearing alarm, specify the value that clears the alarm.
Alarm values for bytes are specified in megabytes and values for time are specified in seconds. Fractional values such as 0.5 megabytes or 0.5 seconds are allowed.
This section explains the threshold being configured.
If you have multiple Application Analytics engines, the alarm threshold can be applied to one or more specific engines or to all engines. Click the Edit button to open a window where you can select the desired engine(s). If no engines are selected, then the alarm threshold will be applied to all engines.
For information on related windows:
For information on related tasks: