These options apply only to the Extreme Management Center's Console application. In the Options window (Tools > Options), the right-panel view changes depending on what you have selected in the left-panel tree. Expand the Console folder to view all the different options you can set.
Information on the following Console options:
- Device Manager
- Discover
- FlexView
- Welcome View
- Property View
- Compass
- VLAN View
- Basic Policy View
- Wireless Manager
- Policy Control Console
- RoamAbout Wireless Manager
- TopN Collector
- NetFlow Collection
- OneView
- OneView Dialog Boxes
- OneView Collector
- OneView Engine
- ACL Manager
Device Manager
Selecting Device Manager in the left panel of the Options window provides the following view where you can specify Device Manager polling options and the colors you want to use in Device Manager tables. Device Manager uses the polling cycles specified here to contact the device and update Device View information.
Click areas of the graphic for more information.
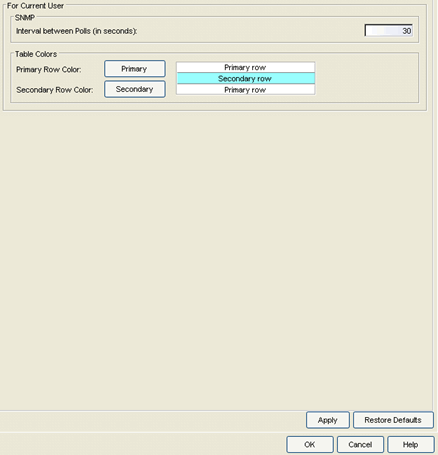
- Interval between poll cycles
- The amount of time (in seconds) that Device Manager waits between polling the device.
- Device Manager Table Colors
- Use the buttons to select the primary and secondary row colors you want to display in tables. A sample of your selection will be displayed in the sample table scheme to the right of your selections.
Discover
Selecting Discover in the left panel of the Options window provides the following view where you can specify options for the Console Discover operation.
Click areas of the graphic for more information.
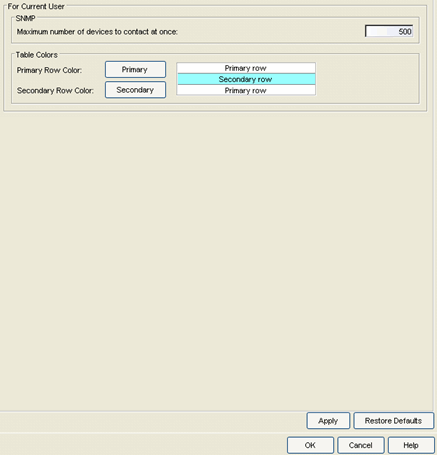
- Maximum number of devices to contact at once
- The number of IP addresses Discover will try to contact simultaneously. Discover works with blocks of IP addresses, starting a new block each time the outstanding block completes.
- Discover Table Colors
- Use the buttons to select the primary and secondary row colors you want to display in tables. A sample of your selection displays in the sample table scheme to the right of your selections.
FlexView
Selecting FlexView in the left panel of the Options window provides the following view where you can specify polling options for the web-based and Console FlexView tables and graphs, the colors used in FlexView tables, and the default export directory for FlexViews.
Click areas of the window for more information.
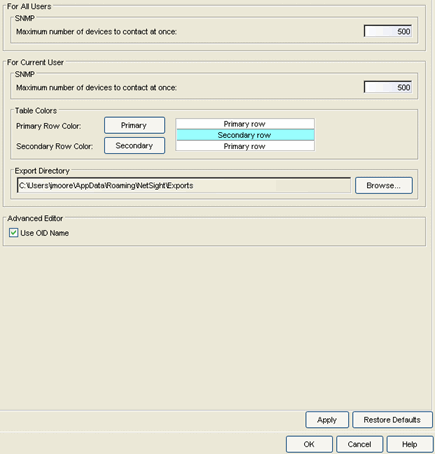
For All Users
These settings specify the polling options for web-based FlexViews accessed through the Management Center's Network tab. These settings applies to all users.
- Maximum number of devices to contact at once
- The number of devices that will be contacted simultaneously. The Management Center server polls blocks of IP addresses, starting a new block each time the outstanding block completes.
For Current User
These settings specify options for FlexViews accessed through Console. These settings will apply to the current logged-in user.
- Maximum number of devices to contact at once
- The number of devices that Console will try to contact simultaneously. Console polls blocks of IP addresses, starting a new block each time the outstanding block completes.
- FlexView Table Colors
- Use the buttons to select the primary and secondary row colors you want to display in tables. A sample of your selection will be displayed in the sample table scheme to the right of your selections.
- Export Directory
- In FlexView Properties, you can configure FlexView table information to be automatically exported with each table refresh, using the Export Type parameter. The exported information is saved by default to the directory specified here.
- Advanced Editor
- The Use OID Name option specifies that the OID name will be used instead of the numeric OID in the XML encoding for the FlexView. Deselecting this option lets you create FlexViews with OID-based SNMP columns that are unique.
Welcome View
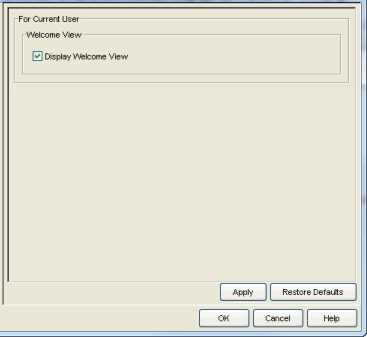
Selecting Welcome View in the left panel of the Options window provides the following view where you can enable or disable the display of the right-panel Welcome tab. The Welcome tab is available when the top-level My Network folder is selected in the left-panel tree. It provides links to Console tasks such as Management Center Discover and Authorization/Device Access windows, and also provides access to video tutorials on these tasks.
Property View
Selecting Property View in the left panel of the Options window provides the following view where you can specify options that define the SNMP polling parameters and appearance of the Properties tab in Console.
Click areas in the window for more information.
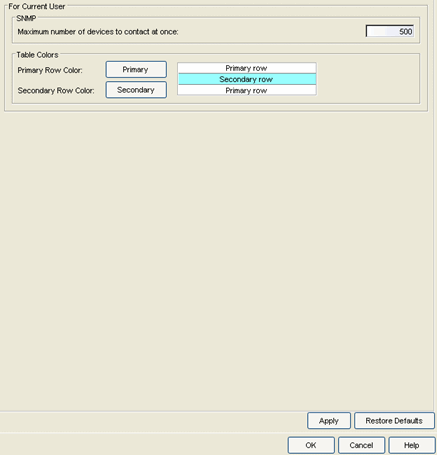
- Maximum number of devices to contact at once
- The number of devices Console will try to contact simultaneously. Console works with blocks of IP addresses, starting a new block each time the outstanding block completes.
- Properties Tab Table Colors
- Use the buttons to select the primary and secondary row colors you want to display in tables. A sample of your selection will be displayed in the sample table scheme to the right of your selections.
Compass
Selecting Compass in the left panel of the Options window provides the following view where you can specify Compass SNMP and Search options.
Click areas of the graphic for more information.
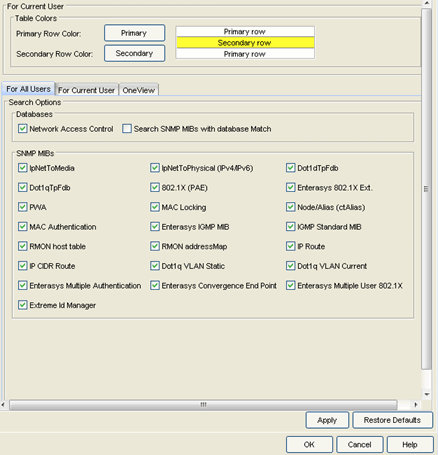
- Compass Table Colors
- Use the buttons to select the primary and secondary row colors you want to display in tables. A sample of your selection will be displayed in the sample table scheme to the right of your selections.
- Search Options
- The boxes that are checked in this section determine which data sources will be used with Compass searches. By default, Compass is configured to include the NAC Manager database (the "Network Access Control" checkbox) as well as various SNMP MIB objects when performing searches. (Refer to the MIB/Table Descriptions topic for information about MIB selections.) The Compass search begins by resolving IP address to MAC address in order to start searching for MAC-IP pairs from the network. When a match is found in the NAC Database, the SNMP MIBs will not be searched unless the "Search SNMP MIBs with database Match" checkbox is also selected. If the "Network Access Control" checkbox is deselected, then the NAC Manager Database will not be used to resolve IP address to MAC address. You can specify search options in three different tabs:
-
- For All Users - These search options apply for all users on all Management Center clients.
- For Current User - These options let you override the All Users search options and instead use this set of search options for the current user. These settings are stored in the user’s home directory and apply only to the Management Center client running on this machine or machines with shared access to the user’s home directory.
- OneView - These options are for the Compass search in Management Center. In addition to search options, they include search limit settings which are used to help limit the Management Center server resources used for the searches:
- Number of searches allowed at once. The maximum number of Compass searches that can be performed at one time.
- Number of search results allowed. The maximum number of search results that can be displayed in the table.
- Number of devices allowed for a search. The maximum number of devices that can be included in a search.
- Time limit for a search. The maximum search time in seconds.
VLAN View
Selecting VLAN View in the left panel of the Options window provides the following view where you can specify options that define the SNMP polling parameters and appearance of the VLAN tab in Console.
Click areas in the window for more information.
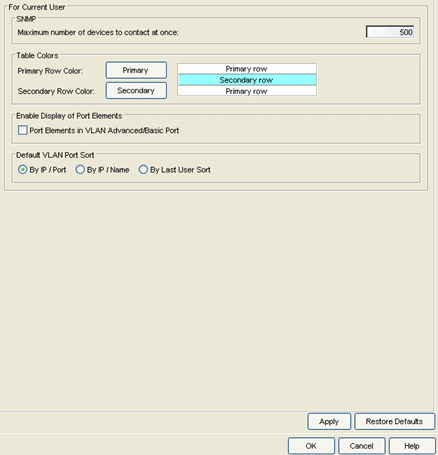
- Maximum number of devices to contact at once
- The number of IP addresses Console will try to contact simultaneously. Console works with blocks of IP addresses, starting a new block each time the outstanding block completes.
- VLAN Table Colors
- Use the buttons to select the primary and secondary row colors you want to display in tables. A sample of your selection will be displayed in the sample table scheme to the right of your selections.
- Enable Display of Port Elements
- Selecting this checkbox filters the port views based on selected port elements, making it easier to use VLAN Manager with groups of port elements.
- Default VLAN Port Sort
- Use the radio buttons to specify how the data in the VLAN Basic Port tab will be sorted by default when the device data is retrieved: by IP address and Port, by IP address and Name, or by the sort used by the last user. The "By Last User Sort" option allows you to continue to use the last sort options you had configured using the Sort Toolbar (available from the right-click menu on a table entry). For example, if you had the sort set to Port (descending) and PVID (ascending) and you close the application, then the next time you open the application, the tab will use that same sort.
Basic Policy View
Selecting Basic Policy View in the left panel of the Options window provides the following view where you can specify options that define the SNMP polling parameters and appearance of the Basic Policy tab in Console.
Click areas in the window for more information.
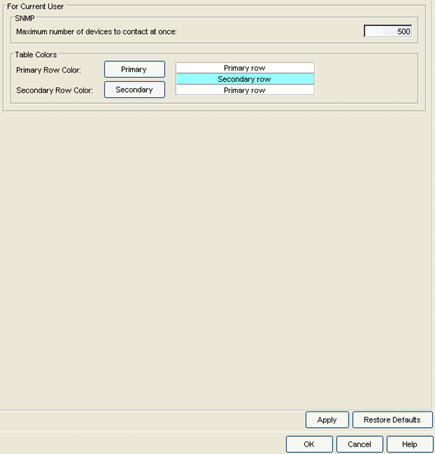
- Maximum number of devices to contact at once
- The number of devices that Console will try to contact simultaneously. Console polls blocks of IP addresses, starting a new block each time the outstanding block completes.
- Basic Policy Tab Table Colors
- Use the buttons to select the primary and secondary row colors you want to use in tables in the Basic Policy tab. A sample of your selection will be displayed in the sample table scheme to the right of your selections.
Wireless Manager
Selecting Wireless Manager in the left panel of the Options window provides the following view where you can specify options for the Wireless Manager application.
Click areas in the window for more information.
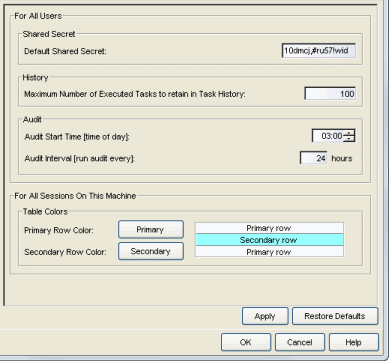
- Shared Secret
- Any time Management Center discovers a new controller, Wireless Manager will attempt to authenticate with the controller using this shared secret. For proper functioning of Management Center, Wireless Manager, and Wireless Advanced Services, the controller must be configured with the same shared secret as Wireless Manager. Each controller can be configured with a different shared secret as long as Wireless Manager knows what it is. You can configure Shared Secrets on a per controller basis using Wireless Manager. Please refer to the Wireless Manager online Help for additional details.
- History
- After a task has executed, it is retained in the Wireless Manager database to provide a detailed history of task activity. A large amount of information is kept for each executed task, including the complete CLI script executed against each target controller. To maintain the database at a reasonable size, Wireless Manager keeps only a fixed number of executed tasks in the database. When the task limit is reached or exceeded, Wireless Manager deletes the oldest executed tasks from its database. The History option allows you to control how many task definitions Wireless Manager will retain in its database. The default is 100 executed tasks retained, and the maximum is 500 tasks retained.
- Audit
- Wireless Manager audits controller configuration to ensure that it does not deviate from the deployed templates. When Wireless Manager encounters discrepancies between the template and the actual controller configuration, the audit feature logs an error. You can manually run an audit or you can schedule automatic audits using these Audit options. Select the time of day when the audit should start and the interval in hours between the start of successive audits. Auditing once every 24 hours is sufficient for most sites, but more frequent auditing can be enabled through this option.
- Table Colors
- You can customize the appearance of the screens in Wireless Manager by applying contrasting colors to alternating table rows. From the drop-down menu, select row colors for alternating primary and secondary rows. A sample to the right provides a snapshot of the way table colors will display on the screen.
Policy Control Console
Selecting Policy Control Console (PCC) in the left panel of the Options window provides the following view where you can specify options that define the SNMP polling parameters for the PCC tool and the authorization group for the PCC appliance.
Click areas in the window for more information.
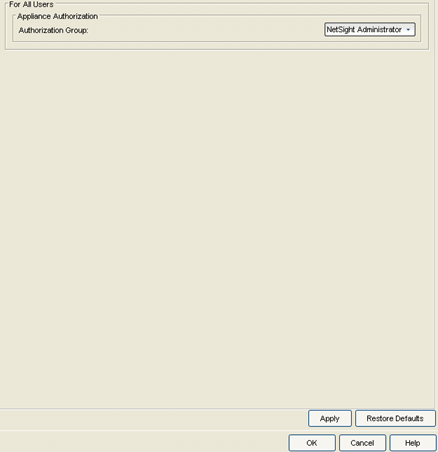
- Appliance Authorization Group
- Use the drop-down list to select the Authorization Group with the correct profile for the PCC appliance to use when communicating with devices. Profiles define the level of device access granted to users that are members of that Authorization Group. Profiles and Authorization Groups are defined in the Authorization/Device Access window (Tools > Authorization/Device Access).
RoamAbout Wireless Manager
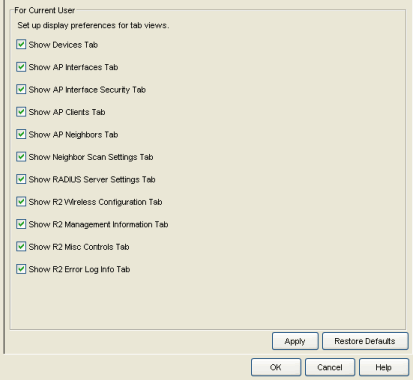
Selecting RoamAbout Wireless Manager in the left panel of the Options window provides the following view where you can specify which right-panel tabs you want displayed in the RoamAbout Wireless Manager main window.
TopN Collector
The TopN Collector collects the data used in Management Center TopN reports. It also collects the signal strength data reported by Wireless Controllers.
You can use this view to enable or disable TopN collection and host name resolution, and specify the number of days to maintain the TopN History. See below for more information on these options.
Click areas in the window for more information.
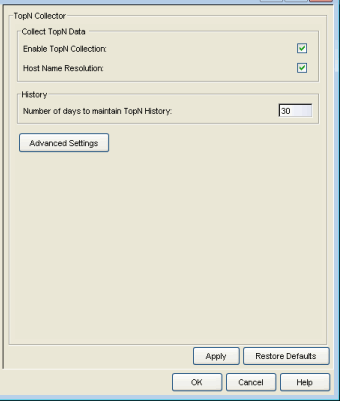
- Enable TopN Collection
- This option allows you to enable and disable the TopN Collector. Changes to this option take place immediately.
- Host Name Resolution
- Select this option to resolve host names to IP addresses and IP addresses to host names, if possible. This option allows you to disable host name resolution for TopN only. (Host name resolution is enabled globally using the Suite Name Resolution option.) Changes to this option take place immediately.
- Number of days to maintain TopN History
- This setting determines how many days of TopN information will be available for viewing in the reports. The default number of days is 30, with a minimum value of 1 day and a maximum value of 180 days. Changes to this option take effect with the next nightly TopN history cleanup task performed by the Management Center server.
- Advanced Settings
- Click the Advanced Settings button to open the TopN Collector Advanced Settings window where you can configure more advanced collector options.
NetFlow Collection
Selecting NetFlow in the left panel of the Options window provides the following view where you can configure NetFlow flow collection settings.
Click areas in the window for more information.
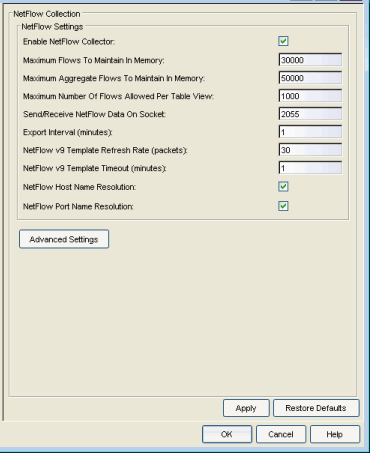
- Enable NetFlow Collector
- Use this checkbox to enable/disable NetFlow packet processing on the Management Center server, allowing you to turn off NetFlow for troubleshooting purposes. When NetFlow is enabled or disabled, a message is logged to the Console log as well as the Management Center server log. When NetFlow is disabled, the Application Flows report on the Management Center Flows tab is cleared. However, the Flow Engine Summary on the Management Center Administration tab continues to show the statistics for previous flows.
- Maximum Flows to Maintain in Memory
- Changing this number would adjust the amount of memory used to store flows.
- Maximum Aggregate Flows to Maintain in Memory
- Changing this number would adjust the amount of memory used to store aggregated flows.
- Maximum Number of Flows Allowed Per Table View
- Sets the maximum number of flows that can be displayed in Management Center NetFlow reports.
- Send/Receive NetFlow Data on Socket
- The port on the Management Center server that listens for flow collection data. If you change this port number here, you also need to reconfigure the port number on the switch.
- Export Interval
- This is the active timer which determines the maximum amount of time a long-lasting flow will remain active before expiring. When a long-lasting active flow expires due to the active timer expiring, another flow is immediately created to continue the ongoing flow. The Management Center flow collector rejoins these multiple flow records to report a single logical flow.
- NetFlow v9 Template Refresh Rate
- The number of export packets sent before the flow sensor retransmits a template to the collector when using NetFlow Version 9.
- NetFlow v9 Template Timeout
- The number of minutes the flow sensor waits before retransmitting a template to the collector when using NetFlow Version 9.
- NetFlow Host Name Resolution
- Select this option to resolve host names to IP addresses and IP addresses to host names, if possible. This option enables host name resolution for NetFlow only. Host name resolution for the Management Center Suite is enabled globally using the Management Center Suite-Wide Name Resolution option. The Suite-Wide option must be enabled for this NetFlow option to take effect.
- NetFlow Port Name Resolution
- Select this option to resolve device port indices to port names and port aliases, and device port names and port aliases to port indices, if possible. This option allows you to disable port name resolution for NetFlow only. (Port name resolution is enabled globally using the Suite Name Resolution option.)
- Advanced Settings
- Click the Advanced Settings button to open the NetFlow Advanced Settings window where you can configure advanced options.
OneView
The OneView options let you specify SNMP polling options for the real-time data collection used in the Management Center Search (PortView) Overview tab.
You can also adjust the maximum number of FlexView or PortView tabs that can be displayed in Management Center at one time. For example, the default limit of five PortViews allows you to have five active searches open at one time. Changing the limit to ten would allow you to have ten active searches open at one time. Keep in mind that adjusting these settings to a higher number could impact Management Center performance.
You can also use this view to set the Date and Time format to be used in Management Center reports.
Click areas in the window for more information.
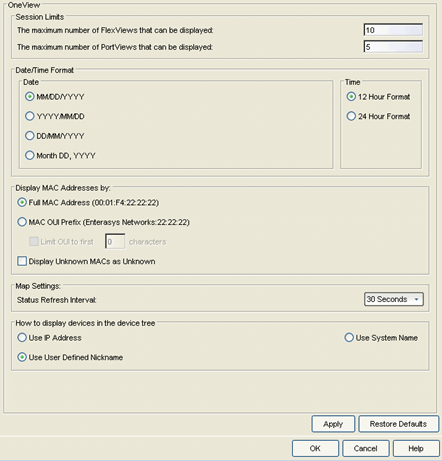
- Session Limits
- Use these settings to specify the maximum number of FlexView and PortView tabs per Management Center server that can be displayed in Management Center at one time. Adjusting these settings to a higher number could impact Management Center performance.
- Date
- Select the option that formats the date -- day (DD), month (MM), and year (YYYY) -- according to your personal preference.
- Time
- Select the option that formats the time -- 12-hour or 24-hour clock -- according to your personal preference.
- Display MAC Addresses by
- Specify how you
want to display end-system MAC addresses in the Management Center Wireless client and threat tables, as well as the Access Control end-system tables. You can display them as a full
MAC address or with a MAC OUI (Organizational Unique Identifier) prefix. This
allows you to display the associated vendor the MAC address belongs to,
if an OUI mapping exists. You can also limit the vendor name to a
certain number of characters, if desired.
When the Display Unknown MACs as Unknown checkbox is selected, the MAC address for unknown users is displayed as "Unknown".
- Status Refresh Interval
- Management Center maps display an integrated alarm/device status either to the right of a device or AP image, or incorporated as part of a map marker. The alarm status automatically refreshes every 30 seconds by default. Use the drop-down list to change the refresh interval, if desired. This option provides a way to adjust the load on the Management Center server if status requests are causing performance issues. You can change the setting to a longer interval or to None, as your situation requires.
How to display devices in the device tree
OneView Dialog Boxes
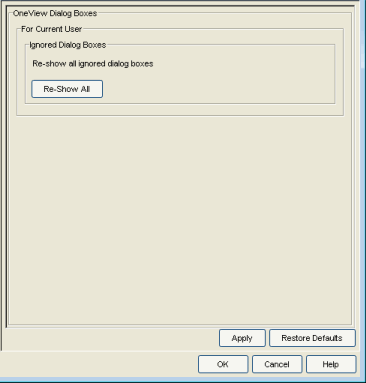
The OneView Dialog Boxes option lets you re-show all message dialog boxes that you have turned off in Management Center (for example, if you have selected the "Do not show this message again" checkbox on a Warning dialog). This setting applies only to the current user.
OneView Collector
The OneView Collector options let you specify SNMP polling options for Management Center (formerly OneView) data collection, enable and disable statistics collection, and access advanced settings for the OneView Collector. The OneView Collector gathers historical reporting data over time, which is then used in Management Center reports.
Click areas in the window for more information.
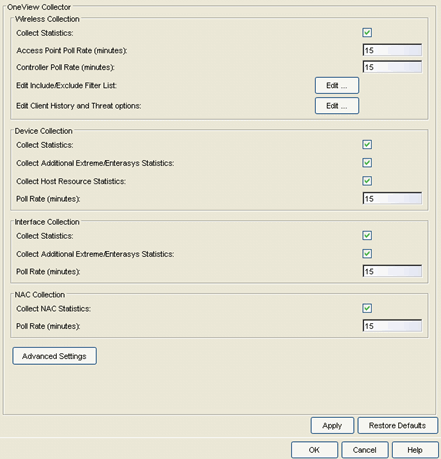
Wireless Collection
- Access Point Poll Rate
- The amount of time (in minutes) that the data collector waits between polling wireless access points. Valid values are 1-60 minutes.
- Controller Poll Rate
- The amount of time (in minutes) that the data collector waits between polling wireless controllers. Valid values are 1-60 minutes.
- Edit Include/Exclude Filter List
- Use this option to filter the client events displayed in the Management Center Wireless Client History, Top Clients by Bandwidth, and Client Event History reports. Click the Edit button to open a window where you can use the drop-down menu to select whether to display client events for:
All SSIDs and Topologies - Client events for all SSIDs and Topologies will be displayed.
Some SSIDs - Select the SSIDs to include or exclude.
Some Topologies - Select the Topologies to include or exclude. The Client Event History report does not support the ability to filter on topologies.
- Edit Client History and Threat options
- Click the Edit button to open a window where you can configure Wireless History Settings. These settings pertain to the Management Center Wireless Client Event History report.
Device Collection
- Collect Additional Extreme/Enterasys Statistics
- Use this checkbox to enable or disable Extreme or Enterasys switch resource statistics collection.
- Collect Host Resource Statistics
- Use this checkbox to enable or disable host resource statistics collection.
- Poll Rate
- The amount of time (in minutes) that the data collector waits between polling devices. Valid values are 1-60 minutes.
Interface Collection
- Collect Additional Extreme/Enterasys Statistics
- Use this checkbox to enable or disable Extreme or Enterasys interface statistics collection.
- Poll Rate
- The amount of time (in minutes) that the data collector waits between polling interfaces. Valid values are 1-60 minutes.
NAC Collection
- Poll Rate
- The amount of time (in minutes) that the data collector waits between polling Access Control engines. Valid values are 1-60 minutes.
- Advanced Settings
- Click the Advanced Settings button to open the OneView Collector Advanced Settings window where you can configure advanced options.
OneView Engine
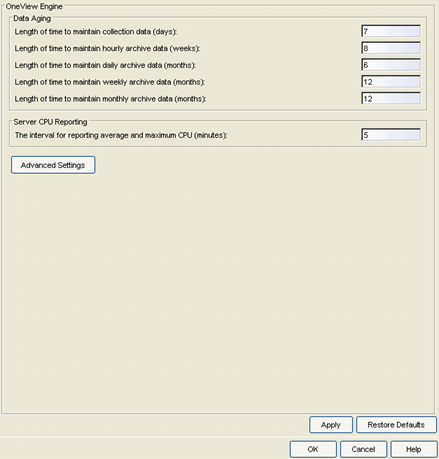
Selecting OneView Engine in the left panel of the Options window provides the following view where you can specify data aging options and advanced settings for data archiving and aggregation.
Click areas in the window for more information.
- Data Aging
- Data aging options determine how long the collection data used by Management Center reports is maintained in the Management Center database. You can set an aging
value for each of the following data types:
- collection data - This setting specifies how long (in days) to maintain the raw data collected by the data collector. Valid values are 1-1000 days.
- hourly data - Every hour, the raw data is condensed into hourly average values and archived. This setting specifies how long (in weeks) to maintain the archived hourly data. Valid values are 1-800 weeks.
- daily data - Every day, the hourly data is condensed into daily average values and archived. This setting specifies how long (in months) to maintain the archived daily data. Valid values are 1-200 months.
- weekly data - Every week, the daily data is condensed into weekly average values and archived. This setting specifies how long (in months) to maintain the archived weekly data. Valid values are 1-200 months.
- monthly data - Every month, the weekly data is condensed into monthly average values and archived. This setting specifies how long (in months) to maintain the archived monthly data. Valid values are 1-200 months.
- Server CPU Reporting
- Extreme Management Center collects Management Center server CPU usage statistics to monitor the Management Center server usage. At 5 minute intervals (the default interval) the collected usage data is averaged, and the average and maximum statistics are reported to the Management Center database to provide data for the Management Center Server CPU Utilization report. You can change the default interval setting here, if desired. A shorter interval would provide a more granular picture of CPU usage while a longer interval would mean that less data is stored in the database. Valid values are 1-59 minutes.
- Advanced Settings
- Click the Advanced Settings button to open the Engine Advanced Settings window where you can configure advanced data archiving, data aggregation, and session limit options.
ACL Manager
Selecting ACL Manager in the left panel of the Options window provides the following view where you can specify options for ACL Manager.
Click areas in the window for more information.
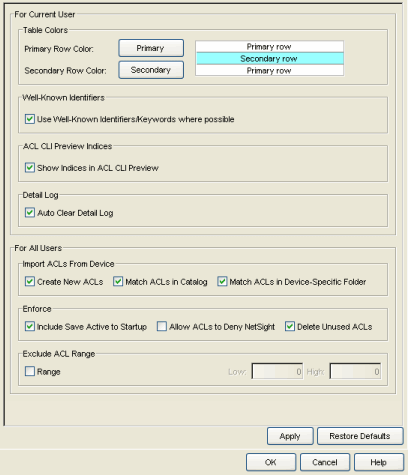
- ACL Manager Table Colors
- Use the buttons to select the primary and secondary row colors you want to display in tables. A sample of your selection will be displayed in the sample table scheme to the right of your selections.
- Well-Known Identifiers
- This option lets you select whether to show the well-known identifier protocol when displaying ACL rules in the ACL Editor tab.
- ACL CLI Preview Indices
- Select the checkbox to display line numbers in the ACL Editor CLI Preview tab.
- Detail Log
- Select the checkbox if you would like to have the ACL Manager Detail Log automatically cleared when Management Center Console is restarted.
- Import ACLs from Device
- Use the checkboxes to select the following parameters when
performing an ACL import from a device:
- Create New ACLs - ACL Manager compares the imported ACLs against ACLs already within the Catalog folder and device-specific folders, checking for duplicates. If a duplicate ACL is found, the ACL is not imported and ACL Manager uses the existing ACL. If a duplicate ACL is not found and this option is selected, a new ACL is created in the ACL Manager database. If this option is not selected, a new ACL will not be created.
- Match ACLs in Catalog - Use this option to specify whether or not ACL Manager will compare imported ACLs against ACLs already within the Catalog folder.
- Match ACLs in Device-Specific Folder - Use this option to specify whether or not ACL Manager will compare imported ACLs against ACLs already within the device-specific folders.
- Enforce
- Use the checkboxes to select the following Enforce operation parameters:
- Include Save Active to Startup - When this options is selected, the Enforce operation saves the Active Configuration to the Startup Configuration for the selected device. The default setting is checked.
- Allow ACLs to Deny (Management Center) NetSight - When this option is selected, ACL Manager no longer checks for ACLs which deny access to the device from the Management Center server. Use of this option could result in lost contact with the device. If contact is denied by an ACL, you must use the device's command line interface (CLI) to remove the ACL and restore contact. The default setting is unchecked.
- Delete Unused ACLs - When this option is checked, ACL Manager will delete any unused ACLs on devices where it performs an Enforce. ACL Manager considers ACLs that are currently defined on a device, but not currently applied to any interfaces or in use by other facilities on the device as Unused. The default setting is checked.
- Exclude ACL Range
-
This option lets you define a range of ACLs that cannot be used by ACL Manager when allocating a new name for an ACL on a device. For example, let's say the excluded range is 101-103:
- If you create a new ACL named "new_acl" and assign it to an interface on a device, when you enforce, ACL Manager determines that ACL "new_acl" needs to be copied to the device. It also determines that "new_acl" is an invalid name on that device because the device only supports numbered ACLs. Therefore, ACL Manager must assign a new name for the ACL on the device. The ACL is an extended ACL, and only ACLs 100-199 can be considered for extended ACLs. So, ACL Manager considers using 100. If 100 is already in use, ACL Manager will consider 101. But 101 is excluded. So ACL Manager will consider 102, 103, and finally 104. 104 is not used and not excluded, so it will be used as the new ACL name on the device.
- If you create a new ACL named 102, and assign it to an interface on a device, when you enforce, ACL Manager determines that ACL 102 needs to be copied to the device. It also determines that 102 is an invalid name on that device because it is in the excluded range. Therefore, ACL Manager must assign a new name for the ACL on the device. The ACL is an extended ACL, and only ACLs 100-199 can be considered for extended ACLs. So ACL Manager will consider using 100. If 100 is already in use, ACL Manager will consider 101. But 101 is excluded. So ACL Manager will consider 102, 103, 104, and finally 105. 105 is not used and not excluded, so it will be used as the new ACL name on the device.
- Restore Defaults Button
- Sets the Options settings in the currently selected view to the (default) values that existed when Console was first installed. Fields are cleared for options that do not have default settings.
For information on related windows:
For information on related tasks: