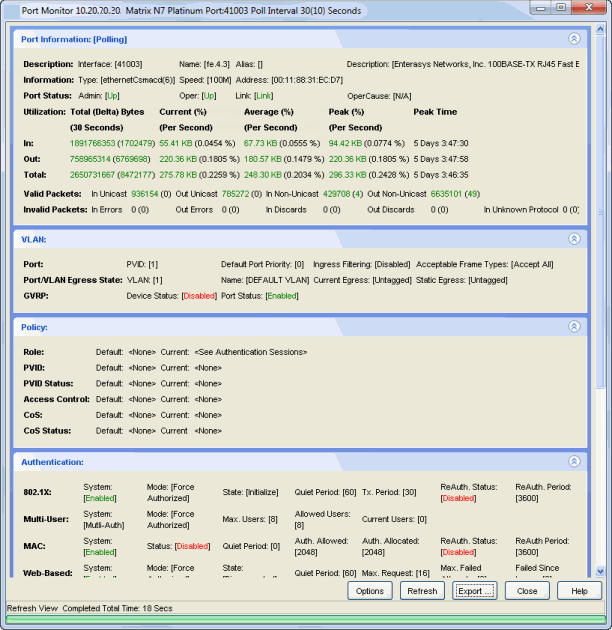
The Port Monitor window lets you view a variety of detailed port information and statistics presented together in one place. To launch the Port Monitor, right-click on a port in any of the following NetSight views and select Port Tools > Port Monitor from the menu.
- Console Properties Tab (Ports View)
- Console Compass Tab (Results Tab)
- Console FlexViews Tabs (for example, the Interface Summary Tab)
- Console tree
- Console VLAN Basic Port and Advanced Port views
- ASM Activity Monitor tree
- NAC Manager End-Systems Tab
- Policy Manager device Details View tab and Ports tab
Use the Options button at the bottom of the window to open the Suite-Wide Options Port Monitor Options panel where you can customize what Port Monitor information will be displayed. Use the arrows on the right-hand side of the window to expand and collapse the different sections of information.
The port data is read from the device when the window is first opened, and then can be updated using the Refresh button. The exception to this is the Statistics data presented in the Port Information section that is polled from the device according to the poll interval specified in the Port Monitor Options panel. Use the Export button to export the Port Monitor data to an HTML file that you can then save, email, or print.
Sample Port Monitor Window

- Port Information
- This section provides detailed port information including port name, type, and status information along with port traffic statistics. The statistics are polled from the device and two poll cycles must be completed before information will be initially displayed. All other port information is read from the device when the window is first opened, and can be updated using the Refresh button. Use the Options button at the bottom of the window to open the Port Monitor Options panel where you can specify polling options. You can also enable and disable the display of the port information statistics in the Options panel.
- VLAN
- This section displays the VLAN settings for the port. For more information on the data presented, refer to the VLAN Tab or VLAN Concepts Help topics, or see the following links:
- Policy
- This section displays the policy settings for the port. For more information on the data presented, refer to the Basic Policy Tab, General Tab (Role), and General Tab (Rule) Help topics. You can enable and disable the display of this data in the Suite-Wide Options Port Monitor Options panel.
- Authentication
- This section displays the authentication settings for the device and the port. The device settings are labeled "System." All other settings refer to port settings. For more information on the data presented, refer to the Policy Manager Port Properties Authentication Configuration Tab and Authentication Tab (Device) Help topics. You can enable and disable the display of this data in the Suite-Wide Options Port Monitor Options panel.
- Authentication Sessions
- The Authentication Sessions table displays port end user sessions. The Results Filter (accessed through a right-mouse click on a column heading or anywhere in the table body) lets you select the result categories that appear in the table (802.1x, MAC, Web-based, etc.). When the Active Sessions checkbox is checked in the Results filter, only your active sessions are displayed. Select an entry in the table to display NAC Manager end-system information for that MAC address, in a line below the table. You can enable and disable the display of this data in the Suite-Wide Options Port Monitor Options panel.
- Bridge Filtering Database
- This table displays the bridge filtering database for the port. Select an entry in the table to display NAC Manager end-system information for that MAC address, in a line below the table. You can enable and disable the display of this data in the Suite-Wide Options Port Monitor Options panel.
- Node/Alias
- This table displays the node/alias entries that match the ifIndex of the port. Select an entry in the table to display NAC Manager end-system information for that MAC address, in a line below the table. You can enable and disable the display of this data in the Suite-Wide Options Port Monitor Options panel.
- MAC Locking
- This table displays MAC locking settings for the port. You can
enable and disable the display of this data in the Suite-Wide Options
Port Monitor Options
panel.
- MAC Locking Globally - whether MAC locking is enabled or disabled on the device.
- Port Status - whether MAC locking is enabled or disabled on the port.
- Trap Status - whether MAC lock trap messaging is enabled or disabled on the port.
- Syslog Status - whether MAC lock syslog messaging is enabled or disabled on the port.
- Aging Status - whether MAC lock aging is enabled or disabled on the port.
- Max Static - the maximum number of MAC addresses that can be locked administratively on the port.
- Max First Arrival - the maximum end station MAC addresses allowed locked to the port.
- Last Violating MAC Address - the most recent MAC addresses violating the maximum static and first arrival values set for the port.