NetSight Console provides a collection of software tools that can help you manage networks of varying complexity. Each is designed to facilitate specific network management tasks while sharing data and providing common controls and a consistent user interface.
Take a Look Around
When Console's main window appears, take a few minutes to explore the main window features (toolbar and menus, left and right panel and the Events panel).
In the left panel, expand the My Network folder and its sub-folders to see the groupings that are provided with Console. The blue folders are system folders and they cannot be deleted or renamed. You'll be able to add your own folders to the My Network folder when you're ready to create device groups for your network. These user-created groups are tan.
As its name implies, the All Devices folder contains all of the devices that have been created in the database. All of the other folders (the All Devices folder, the All Port Elements folder, the Grouped By folder and its sub-folders, and the folders that you create) let you collectively manage groups of devices. The system groupings are automatically maintained by Console, such that when a new device is added to the database, a copy of the device is placed in the appropriate system group folder. You manage the content of your folders using editing tools from the Edit menu, or from the right click popup menu or by dragging and dropping one or more device from one location to another.
Main Window
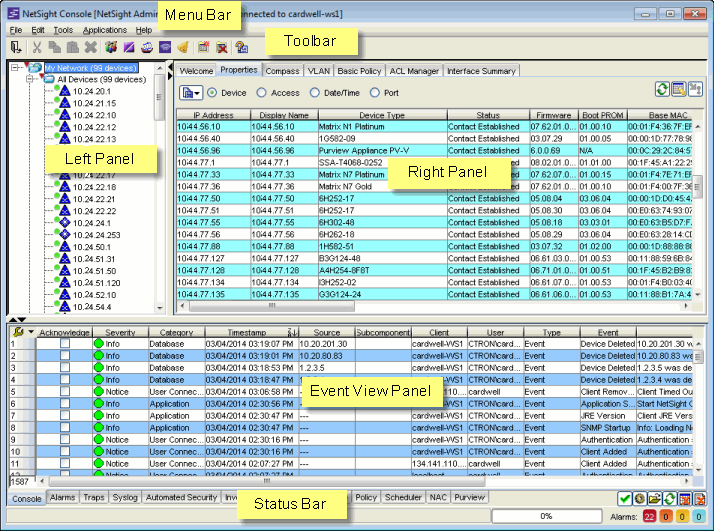
The main window is divided into several functional areas:

Menus
The menu bar provides access to tools and functions that help you manage your network. Specific menu options are dynamically enabled and disabled depending on which window, object, and tab is selected. The Toolbar and right-click menus provide many of the same options available from the menu bar.
Toolbar
The Toolbar on the Main Window provides easy access to some of the more commonly used Console functions. The specific Toolbar buttons that may be active depends on your current selection within the Console application. Pausing with your mouse pointer over the toolbar icons displays tool tips showing the button's function.
Left (tree) Panel
The left panel contains the My Network folder where you'll find device groups containing the devices that you've discovered and modeled in the NetSight database. In addition to the All Devices group and the All Port Elements group, Console provides groups based on Chassis, Contact, Device Type, IP address, and Location. You can also add your own unique groupings according to the management needs of your network.
Right (tabbed) Panel
The device(s) or device group(s) selected in the left panel determines the specific information that appears in the right panel. The following tabs are available in the right panel:
- Properties - This tab presents a table of in-depth information about the devices or device groups selected in the left panel. Four radio buttons let you select between Device properties, Access properties, Date/Time, or Port properties. When your user credentials permit, the Table Editor and Enforce features available with many of Console's tables let you edit cell values and perform SNMP sets for certain writable attributes.
- Compass - This powerful search tool provides information about the status, configuration, and activities at the ingress points of your network. It provides an easy way to search for end stations, or users on end stations.
- VLAN - The VLAN tab provides VLAN configuration and monitoring capabilities.
- Basic Policy - The Basic Policy Tab (Default Port Role view) displays the default policy role configured for each port and lets you change the role, if desired. The Basic Policy Tab (End User Sessions view) displays port end user sessions.
- ACL Manager - ACL Manager provides the tools that let you efficiently manage the Access Control Lists (ACLs) on your Extreme Networks routers.
- Interface Summary and Diagnostic Messages - These tabs present default FlexViews that shows basic interface information (speed, IP Address, type of interface) and diagnostic information for the current left panel selections. FlexViews present information in several formats (table, pie graph, bar graph, and line graph) and allow you to filter the table information and export the information to formats that are compatible with other business applications.
Console provides a FlexView editing capability that lets you modify existing FlexViews and create new ones to serve your need for information.
Event View Panel
NetSight Console's Event View tables let you view alarm, event, and trap information for the NetSight Console, network devices, and other NetSight applications. Each tabbed view lets you scroll through the most recent 50,000 entries in the logs that are configured for that view. A Console tab showing Console events, an Alarms tab showing information about current network alarms, and a Traps tab that captures traps from devices modeled in the NetSight database, are provided when NetSight Console is initially installed. The Syslog tab shows events from devices that are configured to use the NetSight Syslog Server. You can add your own tabs that allow you to monitor events generated by NetSight applications and alarms and traps from network devices.
Status Bar
Operational information is available here as text messages and a progress gauge.
For information on related topics: