This tab presents end-system connection state statistics and vulnerability status (security risks) for an Extreme Access Control engine, an engine group, or all the engine groups, depending on what you select in the left-panel tree. To access this tab, select an engine, an engine group, or the NAC Appliance Groups folder in the left-panel tree, then click the Statistics tab in the right panel.
Select the statistical information you want to view using the drop-down menu at the top of the tab. The following statistical information can be selected:
- End-System Info
- End-System Status
- Most Frequently Occurring Vulnerabilities
- End-System NAC Profile Allocation
- End-System Risk
End-System Info
This selection provides the last known end-system connection state information for the Access Control engine or engine group you select in the left-panel tree. The Display drop-down menu displays information on end-system connection states, extended states, and the reasons why the end-station is in the current state. The information is presented as a bar graph, with each bar representing a specific connection state or reason.
To clear an end-system from the chart, you must delete the end-system from the right-panel End-Systems tab, or use the Remove End-Systems window to clear end-systems prior to and including a specified date.
| TIPS: | -- Double-click on a bar in the charts to open the End-Systems tab as a separate window listing only those
end-systems with the selected connection state or reason. -- Right-click on a chart to access menu options that let you print the chart, save the chart to a file, and zoom in on chart data. |
|---|
States
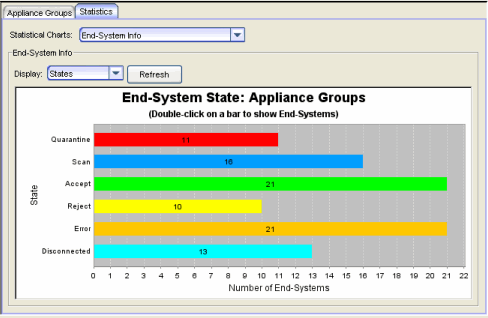
The States chart displays the last known connection state for each end-system attempting to connect. For example, if an end-system is currently being scanned, it is in the Scan state. If the scan fails, the end-system is quarantined and is in the Quarantine state.
End-systems display one of the following connection states:
- Quarantine -The end-system is quarantined because the scanning test failed.
- Scan - The end-system is currently being scanned.
- Accept - The end-system is granted access with either the Accept policy or the attributes returned from the RADIUS server.
- Reject - The end-system is rejected because the assigned NAC profile is set to Reject, the MAC Locking test failed, or the RADIUS server is reachable, but rejected the authentication request.
- Disconnected - All sessions for the end-system are disconnected. This state is only applicable for end-systems connected to switches with RADIUS accounting enabled, or if the Session Deactivate Timeout option is enabled on the Reauthentication tab in Appliance Settings.
- Error - Indicates one of nine problems:
- the MAC to IP resolution failed, if assessment is enabled
- the MAC to IP resolution timed out, if assessment is enabled
- all RADIUS servers are unreachable
- the RADIUS request is non-compliant
- all assessment servers are unavailable
- the assessment server can't reach the end-system
- no assessment servers are configured
- the assessment server is not compatible with the current version of NAC Manager
- the username and password configured in the Assessment Server panel of the NAC Manager options (Tools > Options > Assessment Server) are incorrect for the assessment server
Sample End-System Info - States
Extended States
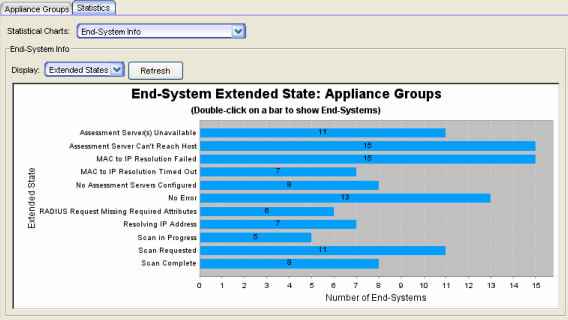
The Extended States chart provides additional information about the end-system connection states. The following five states provide information about the Error state, which results when scanning is required but a scan cannot be performed:
- Assessment Server(s) Unavailable - There are no Assessment servers available to perform a scan on the end-system. If an Assessment server responds to a scan request that it is too busy to perform a scan, the Access Control engine makes a scan request to the next Assessment server. If all your Assessment servers respond that they are too busy, an error is returned. In this case, you need to add more Assessment servers or increase the maximum number of scans your Assessment servers can perform at one time.
- Assessment Server Can't Reach Host - An error is returned because the Assessment server cannot reach the end-system to perform a scan. This may be caused by a routing problem; the Assessment server is not on the same subnet as the end-system. In addition, the Assessment server performs a "reachability" test on the end-system, which may fail because of a firewall on the end-system.
- MAC to IP Resolution Failed - The scan cannot be performed because the end-system's MAC address cannot be resolved to an IP address.
- MAC to IP Resolution Timed Out - The scan cannot be performed because the end-system's MAC address is not resolved to an IP address in the allowed time. (See the IP Address Resolution Timeout option.)
- No Assessment Servers Configured - A scan is required for the end-system, but no Assessment servers are configured in NAC Manager. For more information, see the Manage Assessment Servers window.
Other possible extended states are:
- No Error - End-system authentication and assessment completed without errors.
- RADIUS Request Missing Required Attributes - The attributes returned from the RADIUS server were not sufficient for processing.
- Resolving IP Address - MAC to IP Address Resolution is being performed for the end-system.
- Scan in Progress - Provides additional information for the Scan state; the end-system re-authenticated while a scan is in progress.
- Scan Requested - Provides additional information for the Scan state; a scan is requested for the end-system.
- Scan Complete - Provides additional information for the Scan state; a scan is completed for the end-system.
Sample End-System Info - Extended States
Reasons
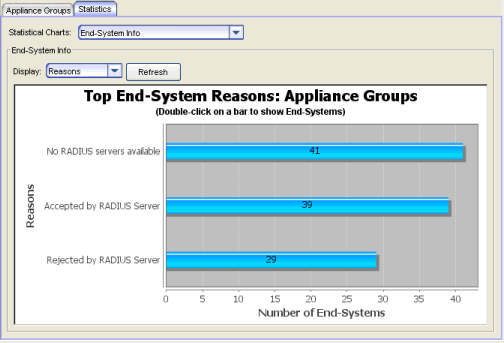
This chart provides additional information about the reasons why the end-systems are in their particular connection states. It gives you an idea as to why a certain policy applies to an end-system or why the end-system is rejected.
Sample End-System Info - Reasons
End-System Status
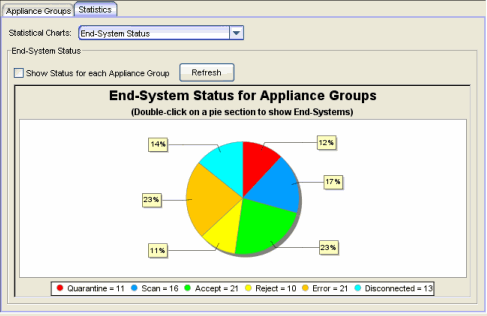
This chart presents the last known end-system connection states for the Access Control engine or engine group select in the left-panel tree. The information is presented as a pie chart, with each color-coded slice representing a specific connection state. Holding the mouse pointer over a particular slice shows a tool tip that identifies the total number of end-systems with that particular state.
The chart displays the last known connection state for each end-system attempting to connect. For example, if an end-system is currently being scanned, it is represented as blue. Once the scan is complete, if the end-system goes to a Quarantine state, it is represented as red. To clear an end-system from the chart, you must delete the end-system from the right-panel End-Systems tab, or use the Remove End-Systems window to clear end-systems prior to and including a specified date.
If you are viewing statistics for all engine groups, use the Show Status for each Appliance Group checkbox to display individual pie charts for each group. If you are viewing statistics for a single engine group, use the Show Status for Each NAC Appliance checkbox to display individual pie charts for each engine in the group.
| TIPS: | -- Double-click on a pie section to open the End-Systems tab as a separate window listing only those
end-systems with the selected connection state. -- Right-click on the chart to access menu options that let you print the chart or save the chart to a file. |
|---|
Sample End-System Status
Most Frequently Occurring Vulnerabilities
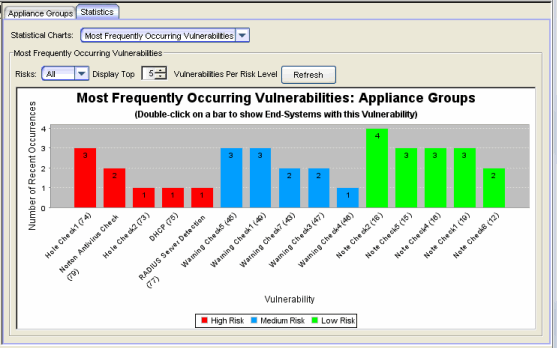
This chart displays the top ten agent-less vulnerabilities for the Access Control engine or engine group you select in the left-panel tree. The information is gathered from the latest end-system health results (scan results) and provides important information about the security risks found on the end-systems during the scan. The information is presented as a bar graph, with each bar representing a vulnerability identified by Test Case name and ID.
| NOTE: | Vulnerabilities with no Test Case IDs are grouped together and
represented by a single bar in the chart (if there are enough of them). |
|---|
Each vulnerability is assigned a risk level:
- High (corresponds to a Hole - the port is vulnerable to attack)
- Medium (corresponds to a Warning - the port may be vulnerable to attack)
- Low (corresponds to a Note - there may be a security risk on the port)
| TIPS: | -- Double-click on a bar to open the End-Systems tab as a separate window listing only those
end-systems with the selected vulnerability and risk factor. -- Right-click on the bar graph to access menu options that let you print the chart or save the chart to a file. You can also use this menu to zoom in and out on the chart data. |
|---|
Sample Most Frequently Occurring Vulnerabilities
End-System NAC Profile Allocation
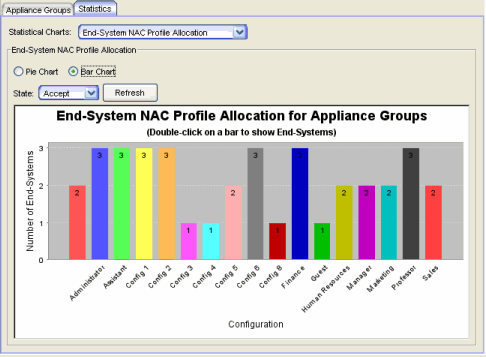
This chart displays the number and/or percentage of end-systems using a particular NAC profile. The statistics can be viewed as a pie chart or a bar chart, with each color-coded slice or bar representing the NAC profile being used. Holding the mouse pointer over a particular slice or bar shows a tool tip that identifies the total number of end-systems using that particular configuration. Use the State drop-down menu to display the allocation information for any connection state: Accept, Reject, Quarantine, Scan, Disconnected, or Error. The NAC profile displayed for Disconnected end-systems is the profile assigned to the end-systems in their previous state when still on the network. The NAC profile displayed for Rejected end-systems is the profile assigned if the end-system successfully connected to the network.
To clear an end-system from the chart, you must delete the end-system from the right-panel End-Systems tab, or use the Remove End-Systems window to clear end-systems and end-system events prior to and including a specified date.
| NOTE: | There is a case where the chart may show statistics for two (or more)
NAC profiles using the same profile name. If an
end-system on an Access Control engine uses the Sales NAC profile. If you
change the parameters on the Sales profile (but keep the same name) and
another end-system on the same engine uses this revised profile, then the chart shows two separate
bars or slices for
the Sales profile. |
|---|
Sample End-System Configuration Allocation
End-System Risk
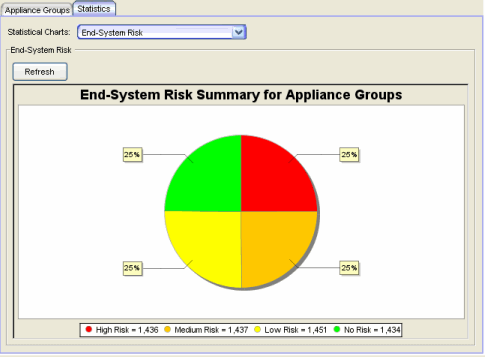
This chart presents a summary of the overall end-system risk levels. The Risk Summary includes the last known health result risk level for each end-system attempting to connect. The information is presented as a pie chart, with each color-coded slice representing the percentage of the end-systems in each risk level. The legend below the graph displays the total number of end-systems with that particular risk level.
| TIP: | Right-click on the chart to access
menu options that let you print the
chart or save the chart to a file. |
|---|
Sample End-System Risk Summary
Right-Click Menu Options
NAC Manager provides right-click menu options and tools that let you easily save, print, and zoom in on statistical charts. You can access these tools by right-clicking on a chart and selecting an option from the menu:
- Save As - lets you save the graph in .png format.
- Print - lets you print the graph.
- Zoom In - zoom in on one or both axes.
- Zoom Out - zoom out on one or both axes.
- Auto Range - set one or both axes back to the default range.
| TIP: | In bar charts, you can click and drag your mouse from left to right to zoom in on a specific section of the graph. Click and drag from right to left to zoom back out.
|
|---|
For information on related windows: