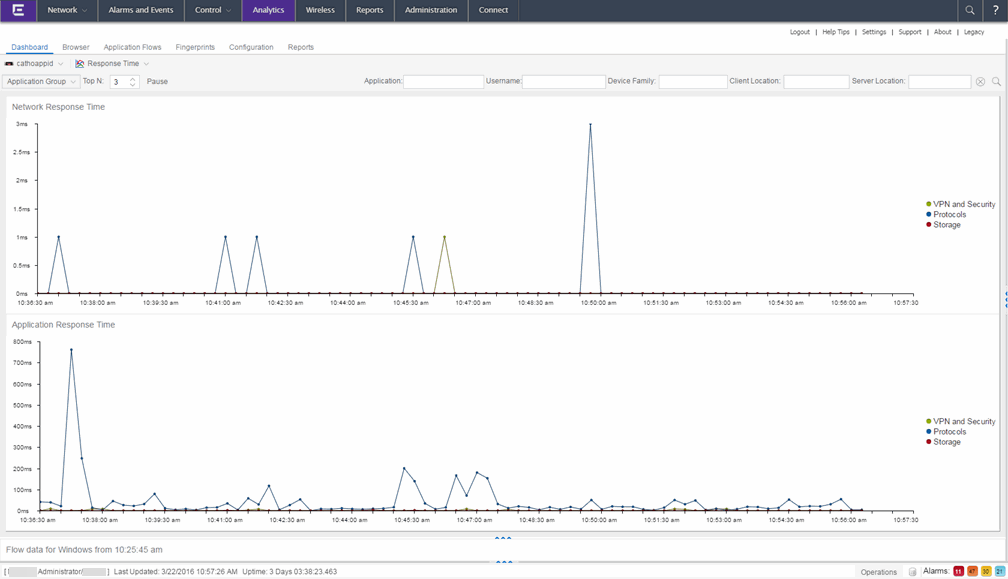
The Response Time Dashboard displays the network and application response time data for the slowest targets on your network based on response time for the last 20 minutes.
Extreme Management Center allows you to view response time data for a variety of targets, including application, device family, and username. For additional information, see Target.
The dashboard also allows you to select the number of targets for which the response time is displayed. Additionally, the Response Time Dashboard allows you to filter based on certain criteria and view flow data specific to the data you select.
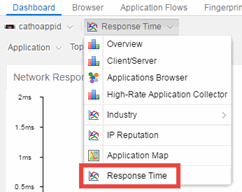
To access the Response Time Dashboard, open the Analytics > Dashboard tab and select Response Time in the dashboard drop-down menu.


Overview
The Response Time Dashboard contains two graphs, one displays the network response time and the other displays the application response time. Data is updated every 15 seconds and displays data over the last 20 minutes.
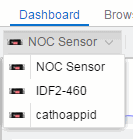
If you have multiple Application Analytics engines, use the Engine drop-down menu to select an engine to use as the source for the report data.

The toolbar at the top of the window allows you to display data based on criteria you select and updates the two graphs.

Target
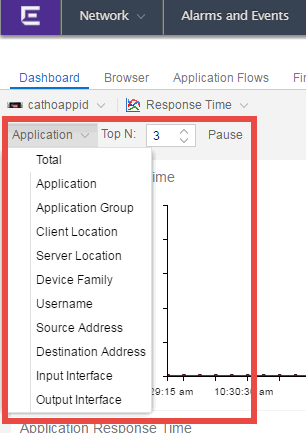
The Target drop-down menu allows you to group the data in the Response Time Dashboard by the following criteria:
- Total
- Application
- Application Group
- Client Location
- Server Location
- Device Family
- Username
- Source Address
- Destination Address
- Input Interface
- Output Interface
Top N
The Top N field allows you to limit the results in the graphs to display only the top results based on the number you enter.
For example, you can configure the graphs to display the top 3 slowest applications by response time as shown in the above screenshot.
Filters
You can also use the filter options at the top of the window to search for specific criteria. Using these fields allow you to limit the data to an Application, Username, Device Family, Client Location, and Server Location. Entering a value in one of these fields filters the results displayed in the graphs below. Clear the data by clicking the Clear ( ) button to the right of the filter options.
Network Response Time Graph
The Network Response Time graph displays the response time (in milliseconds) the TCP request took to complete for the Top N slowest Targets. The data in this graph depends on the criteria you select in the toolbar at the top of the window and can be filtered to match specific criteria. Management Center displays data collected by the Application Analytics engine over the previous 20 minutes updated every 15 seconds. Use the Pause button in the toolbar to stop the graph from updating. Clicking the Unpause button resumes the updates and refreshes the graph with the most up-to-date data.

Hover over a point in the graph to see a pop-up with details about that application at that moment in time.
Clicking on a point opens a flow data table for that Target at that time at the bottom of the window, limited to match any filters you applied. Right-click a row in the flow to see additional options for working with that flow.
Click the Arrow button ( ) at the top of the flow data table to collapse the table and click the Arrow button (
 ) on the collapsed table to expand the table again.
Application Response Time Graph
The Application Response Time graph displays the response time (in milliseconds) the application request took to complete for the Top N slowest Targets. The data in this graph depends on the criteria you select in the toolbar at the top of the window and can be filtered to match specific criteria. Management Center displays data collected by the Application Analytics engine over the previous 20 minutes updated every 15 seconds. Use the Pause button in the toolbar to stop the graph from updating. Clicking the Unpause button resumes the updates and refreshes the graph with the most up-to-date data.

Hover over a point in the graph to see a pop-up with details about that application at that moment in time.
Clicking on a point opens a flow data table for that Target at that time at the bottom of the window, limited to match any filters you applied. Right-click a row in the flow to see additional options for working with that flow.
Click the Arrow button ( ) at the top of the flow data table to collapse the table and click the Arrow button (
 ) on the collapsed table to expand the table again.
For information on related Application Analytics topics: