Top Menu
The Menu at the top of Extreme Management Center screens provides useful links to additional information regarding Management Center. The links available in the Menu are:
- Logout — Logs the current user out of Management Center.
- Help Tips — Opens a pop-up message that provides a suggestion of tasks accomplished on the current screen.
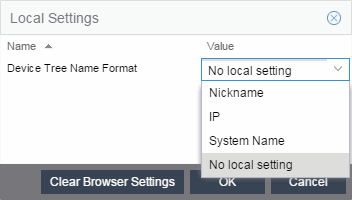
- Settings — Clicking the Settings link on the top right of the Network tab opens the Local Settings window, shown below, from which you can select how the Device navigation tree displays the name of your devices using the Device Tree Name Format drop-down menu.
- Nickname — Displays device names in the Device navigation tree using the Nickname entered when you added the device.
- IP — Displays device names in the Device navigation tree using the IP address of the device.
- System Name — Displays device names in the Device navigation tree using the system name of the device.
- Additionally, clicking the Clear Browser Settings button changes your Management Center settings back to the system default.
- Support — Opens the Extreme Networks Support Web site in a new window.
- About — Opens a new window that provides information about the version of Management Center you have installed and the End User License Agreement. Additionally, the window contains links to the Extreme Networks Web page, the Extreme Networks Support Web page, and the Release Notes for your version of Management Center.
- Legacy — Opens a new window that allows you to access legacy Java-based applications, including Console, Automated Security Manager, Inventory Manager, NAC Manager, and Policy Manager.
Bottom Menu
The Bottom menu in Management Center windows provides access to additional information about operations and processes occurring in Management Center.

- [User Authorization Group/Username]
- The left corner of the bottom menu displays your authorization group and username contained within brackets ([ ]). For example, in the above screenshot, the user currently logged in to Management Center is demow, who belongs to the purviewrw authorization group.
- Last Updated
- The date (in mm/dd/yyyy format) and time (in hh:mm:ss format) of the most recent Management Center update.
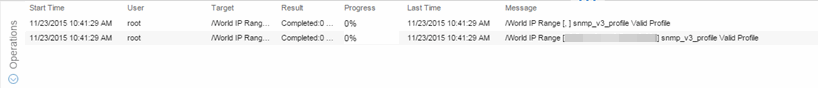
- Operations

- Click the Operations button to open the Operations table at the bottom of the window. This displays the status of any completed or currently occurring operations and details about the process. To close the table, click the down arrow button to the left of the table.
-
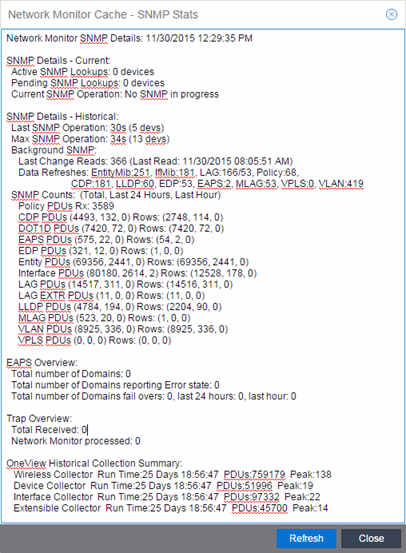
- Network Monitor SNMP Button

- Click the Network Monitor SNMP button to open the Network Monitor Cache - SNMP Stats window. This displays the current and historical SNMP (Simple Network Management Protocol) details as well as EAPS, Trap, and Management Center Historical Collection Summary statistics. Click the Refresh button to refresh the information in the window.
-
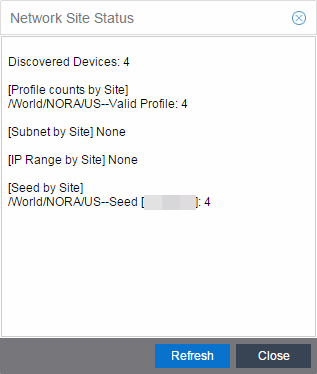
- Network Site Button

- Click the Network Site button to open the Network Site Status window. This displays the status of any devices discovered on your network. Click the Refresh button to refresh the information in the window.
-
- Alarms Buttons
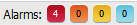
- The lower right corner contains the Alarms buttons, which indicates the number of current alarms for each severity (Critical, Error, Warning, and Info) present in the entire system. If there are no current alarms, the status displays all zeroes. Click on an indicator to open the Alarms tab filtered to display the alarms of that severity. For more information, see Alarms and Events.