This Help topic describes how to launch Wireshark® against a Policy Manager role, providing a quick, visual representation of how the role would handle network traffic. Wireshark can be launched against either a pre-existing data capture (.pcap file) or a live data capture (local and remote), and uses color filters to color the traffic based on the actions configured for the role's rules or the role's default action. This allows you to see how the traffic would have been handled had the role been applied to the end-system at the time of the traffic capture.
You can create color filters for the following action types:
- Access Control
- Class of Service (802.1p Priority)
- System Log
- Audit Trap
- Disable Port
- Traffic Mirror
Because Wireshark is launched against a role's current configuration, and not the current configuration on a network device, you do not need to configure any network device in order to see how the role will handle traffic. This makes Wireshark very useful when planning your network roles, by demonstrating the benefits of the role before enforcing the role to your network devices.
In addition, Policy Manager provides the ability to simultaneously launch multiple instances of Wireshark, allowing:
- Side-by-side comparison of two roles against the same captured data.
- Side-by-side comparison of the same role with different rule sets against the same captured data.
This Help topic assumes that you have installed Wireshark and are familiar with its usage. Before using Wireshark with Policy Manager, make sure that the location of the Wireshark executable is set correctly in the Policy Manager Wireshark option (Tools > Options > Policy Manager > Wireshark). For information on installing and using Wireshark, go to www.wireshark.org.
Instructions on:
Launching Wireshark
The steps for launching Wireshark vary slightly depending on whether you will be launching Wireshark against a data capture file, live local traffic, or live remote traffic. Each method for launching Wireshark is described below.
Launching Against a Data Capture
- In the left-panel Roles tab, right-click on the role you want to
view with Wireshark, and select
the Launch Wireshark with Rule Color Filters option from the menu.
The Launch Wireshark window opens.
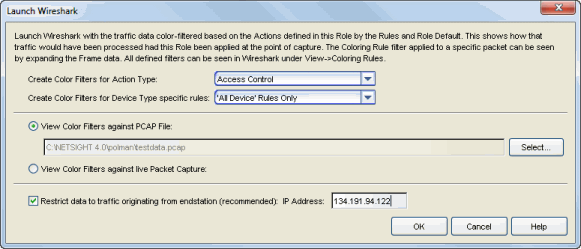
- Select the Action Type you would like color filters created for. Wireshark will color-filter the traffic data based on how that specific action type is defined in the role by the rules and the role default actions.
- If you want to create color filters only for certain device type specific rules, use the drop-down list to select the device type. Otherwise, select "All Device" Rules Only.
- Select the View Color Filters against PCAP File radio button, and use the Select button to navigate to the .pcap file you want to use.
- Select the Restrict data to traffic originating from endstation checkbox. This option will filter out return and broadcast traffic, allowing Wireshark to accurately reflect only the traffic that would be filtered by the role being applied to a user. Enter a valid IP address or hostname for the endstation, or enter "localhost." Click OK.
- Wireshark opens, displaying the data. Go to Viewing Wireshark for
information on viewing the data.
NOTE: If no data appears when Wireshark opens, the endstation IP address entered in step 4 does not match the source IP of any traffic in the .pcap file.
Launching Against Live Local Traffic
- In the left-panel Roles tab, right-click on the role you want to
view with Wireshark, and select the Launch Wireshark with Rule Color Filters option from the menu.
The Launch Wireshark window opens.
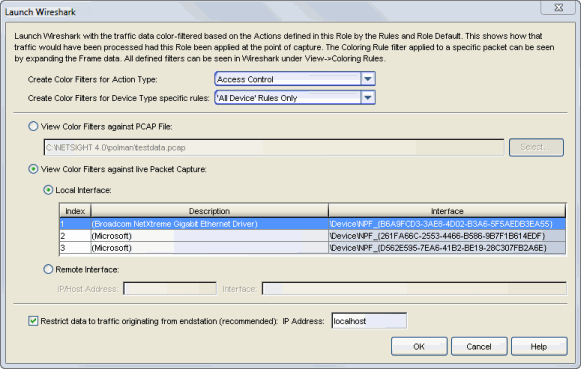
- Select the Action Type you would like color filters created for. Wireshark will color-filter the traffic data based on how that specific action type is defined in the role by the rules and the role default actions.
- If you want to create color filters only for certain device type specific rules, use the drop-down list to select the device type. Otherwise, select "All Device" Rules Only.
- Select the View Color Filters against live Packet Capture radio button, and then the Local Interface radio button. Select the appropriate interface in the table. If multiple interfaces are displayed, it is important to select the one from which traffic is being sent.
- Select the checkbox Restrict data to traffic originating from endstation. This option will filter out return and broadcast traffic, allowing Wireshark to accurately reflect only the traffic that would be filtered by the role being applied to a user. Verify that the endstation's IP address, hostname, or "localhost" (the default) is entered in the field. See the Note below if you are configuring Wireshark in a port mirroring scenario. Click OK.
- Wireshark opens, displaying the data. Go to Viewing Wireshark for information on viewing the data.
Launching Against Live Remote Traffic
- In the left-panel Roles tab, right-click on the role you want to
view with Wireshark, and select the Launch Wireshark with Rule Color Filters option from the menu.
The Launch Wireshark window opens.
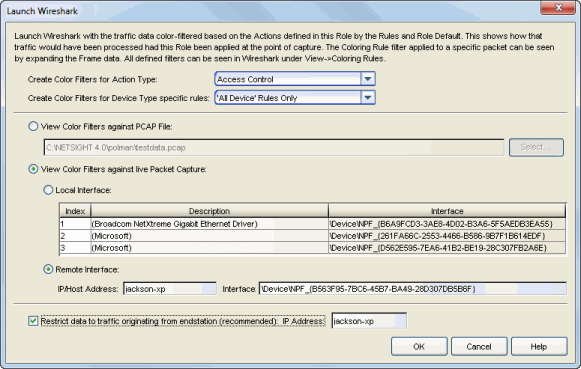
- Select the Action Type you would like color filters created for. Wireshark will color-filter the traffic data based on how that specific action type is defined in the role by the rules and the role default actions.
- If you want to create color filters only for certain device type specific rules, use the drop-down list to select the device type. Otherwise, select "All Device" Rules Only.
- Select the View Color Filters against live Packet Capture radio button, and then the Remote Interface radio button.
- Enter the proper values to capture data on a remote endstation.
You must have a remote pcap daemon (e.g. rpcapd) running on the specified endstation, with
NULL authentication allowed (-n flag).
- Enter the endstation's IP address or hostname.
- Enter the interface value, which should look similar to:
\Device\NPF_{F6E3014E-83EC-4EB4-994C-1D5F3963B12A}
There are a couple of ways you can determine the interface value:- If Wireshark is installed on the remote endstation, you can see the interface values in the Wireshark application if it is launched. Additionally, running Wireshark from the endstation command line with the "-D" flag will output the interface values.
- The Nmap Application (www.nmap.org)
is another mechanism for detecting the interface value. The interface string for the
remote interface can be determined by running
nmap --ifliston the remote endstation.
- Select the checkbox Restrict data to traffic originating from endstation. This option will filter out return and broadcast traffic allowing Wireshark to accurately reflect only the traffic that would be filtered by the role being applied to a user. Verify that the endstation's IP address or hostname is entered in the field. See the following Note if you are configuring Wireshark in a port mirroring scenario. Click OK.
- Wireshark opens, displaying the data. Go to Viewing Wireshark for information on viewing the data.
Viewing Wireshark
Once you have launched Wireshark using the instructions in the previous section, the Wireshark window opens displaying the traffic data. The data is colored according to the rules defined by the role, and the role default actions.
Wireshark Color Filter Scheme
The Wireshark color filter scheme that is used varies according to the selected Action Type:
- Access Control
- Discarded traffic is colored black
- Discard Rule = pink text
- Role Default Discard = white text
- Permitted traffic is colored green
- Permit Rule = bright green
- Role Default Permit = pale green
- Contained to a VLAN traffic is colored yellow
- Contain Rule = bright yellow
- Role Default Contain = pale yellow
- Discarded traffic is colored black
- Class of Service (802.1p Priority) Each of the 802.1p Priorities (0-7) are assigned a different color filter ranging from bright green to bright red for rules and from pale green to pale red for role defaults. For rules using a user-defined class of service with no priority, the color filter is blue.
- System Log
- Prohibited Rule = yellow
- Enabled Rule = bright green
- Role Default = pale green
- Audit Trap
- Prohibited Rule = yellow
- Enabled Rule = bright green
- Role Default = pale green
- Disable Port
- Prohibited Rule = yellow
- Enabled Rule = bright red
- Role Default = pale red
- Traffic Mirror
- Prohibited Rule = yellow
- Enabled Rule = bright green
- Role Default = pale green
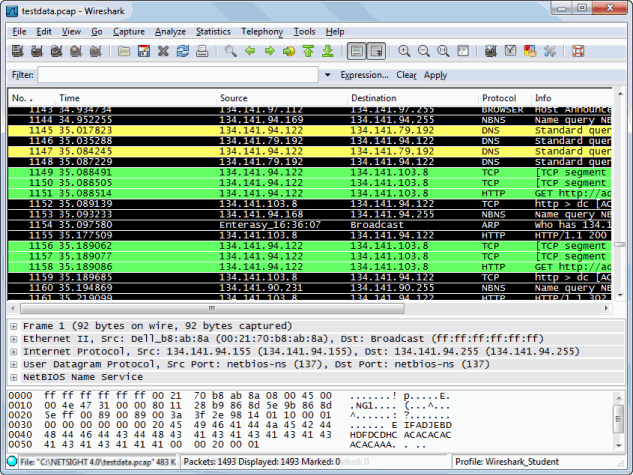
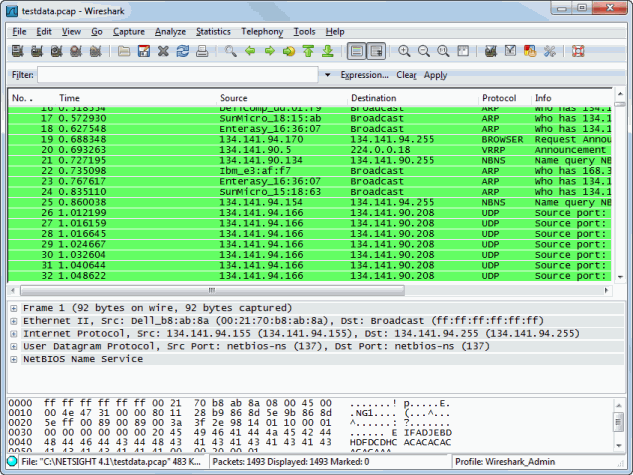
The following two examples display Wireshark launched against a data capture
file using two different roles: Student and Admin. The first example shows how
the Student role contains DNS traffic (pale yellow), denies certain traffic (black),
and permits Web traffic (bright green).
This second example shows how the Admin role allows all traffic (bright green)
according to the role's permit rules.
Determining Rule Hit
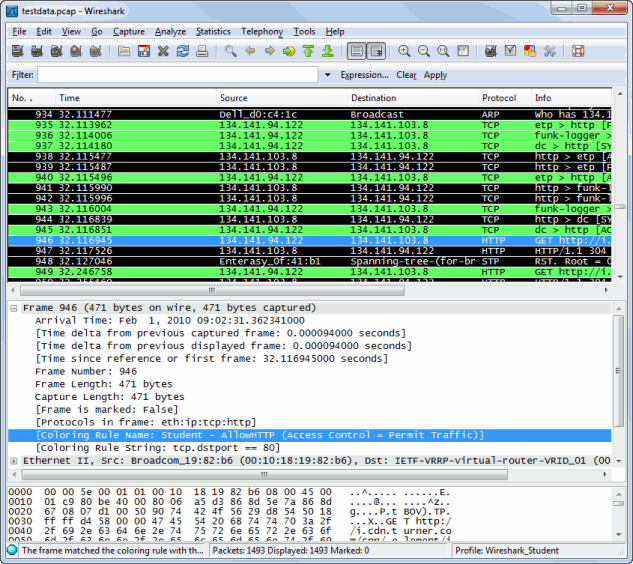
You can determine the specific rule that each packet hit by selecting the packet
in the table, and then looking in the Coloring Rule Name field in
the Frame packet data at the bottom of the screen.
The example below shows that the "AllowHTTP"
rule in the Student role caused the selected packet to be permitted (bright green).
Viewing Color Filters
You can view all the color filters used for a role by selecting View > Coloring
Rules from the Wireshark window. Refer to the Wireshark documentation for information
on using the Coloring Rules window.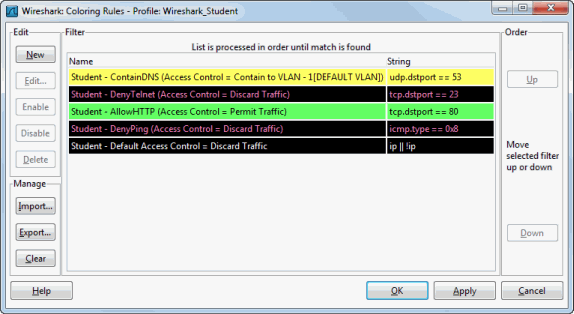
For information on related tabs: