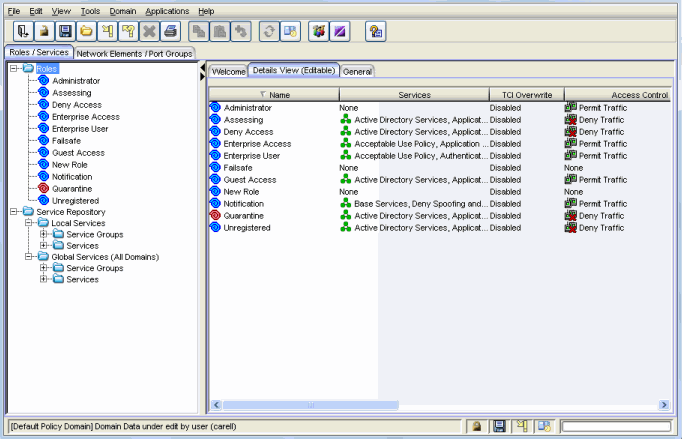
The Policy Manager main window is the central point for all Policy Manager tasks. It is divided into a left panel and a right panel. The tabs in the left panel display hierarchical trees that represent the roles, services, network elements, and port groups involved in managing policies for your network. The tabbed pages in the right panel display detailed information about the item selected in the left panel.
The trees in the left panel tabs can be organized in different "tab configurations." By default, Policy Manager opens using a Consolidated Tab Configuration. In the Consolidated Tab Configuration, there are two left-panel tabs: Roles/Services and Network Elements/Port Groups. Access Control, Class of Service, and Network Resources are launched in separate configuration windows from the Edit menu.
You can change the tab configuration using the Tab
Configuration option panel (Tools > Options > Tab
Configuration), if desired. Instead of the
Consolidated Tab Configuration, you can select the Classic
Tab Configuration which was used in Policy Manager prior to
version 4.0, or a Custom Tab Configuration which allows you
to define which tab the different trees will be
organized under. Whatever configuration you select in
the options panel will be the default configuration used by all domains. However,
you can also override the default configuration on a
per-domain basis using the View > Domain Tab
Configuration menu. For more information on available
Tab Configurations, see the
Tab Configuration
Option Help topic.
The menu bar and the toolbar at the top of the window
provide access to Policy Manager functions
and let you perform policy-related tasks. The status bar at the bottom of the window
displays error and status information.
Information on the Main window features:
Click the tree items for more information.

Dialog Boxes (Messages)
In the course of using Policy Manager, you will see message dialog boxes confirming that certain tasks have been completed, or warning you of the consequences of a certain action. Many of these dialog boxes give you the option of turning off subsequent displays of the message, and once you have become accustomed to using Policy Manager you may want to take advantage of this option. You can also turn off the display of all information message dialog boxes in the Dialog Boxes view accessible from the Tools > Options menu option. In that view, you can also turn on the message dialog boxes that you have turned off on the individual dialog box(es).
Icons
The icons used in Policy Manager and their meanings are as follows:
| Icon | Definition | Icon | Definition |
|---|---|---|---|
|
|
Pre-Defined Groups |
|
User-Defined Groups |
|
|
Device/Wireless Device |
|
Port Group |
|
|
Port |
|
Frozen Port |
|
|
Role |
|
Quarantine Role |
|
|
Rule |
|
Disabled Rule |
|
|
Device-specific Rule |
|
Service Group |
|
|
Automated Service |
|
Manual Service |
|
|
Network Resource Group |
|
Slot/Logical Ports/Ports |
|
|
Contain VLAN |
|
Deny VLAN |
|
|
VLAN or Network Resource Island |
|
Island VLAN |
|
|
Warning |
|
CoS (Class of Service) |
|
|
802.1p Priority |
|
IP Type of Service Value |
|
|
CoS Port Group |
|
Rate Limit |
|
|
Transmit Queue |
|
Network Resource Topology |
Status Bar Icons
The following icons appear in the status bar:
-
 Lock
Lock
- Reminds you that the current Policy Domain is locked for editing purposes. You can lock and unlock the domain from the Lock tool bar button.
-
 Save
Save
- Reminds you that you've made changes, and that you need to save the Policy Manager data to the Policy Domain. Double-clicking this icon initiates the save operation. Only users with the capability to Enforce will be able to save the domain.
-
 Enforce
- Reminds you that you've made changes to roles that you need to enforce. Double-clicking this icon initiates the enforce operation.
-
 Event Log
- This icon is displayed when a new Warning or Error message has been logged to the Event Log. Double-click the icon to open the Event Log window.
For information on related windows: